
In this post:
- What is a rare market signal that tells traders to prepare for a possible significant decline?
- In what year did the S&P 500 drop by 35% and what did it mean?
A rare market signal with a foreboding name is telling traders to prepare for a possible significant decline. Invoking the memory of the flaming explosion of LZ 129 Hindenburg in 1937. The stock market “Hindenburg Omen” signal plays on images of a monumental disaster. It is easy to see why many of such observations preceded the 35% drop in the S&P 500 in early 2020 – certainly a stock market disaster by any measure. However, when these signals are present, it may be good practice to form an exit strategy and help mitigate any potential losses. Let’s dig into what this indicator is and why its signals are important warnings for precarious market circumstances.
What is the Hindenburg Omen?
The Hindenburg Omen is a term used in stock trading where certain market conditions align to form a signal. For instance, it’s a warning that conditions are ripe for a steep market decline.
What are the market conditions to incite this tumble? Look for the following four conditions all occurring on the same day:
- The number of new NYSE 52-week highs is greater than 2.8% of all unchanged issues.
- The number of new NYSE 52-week lows is greater than 2.8% of all unchanged issues.
- The number of new 52-week highs is not more than double the number of new 52-week lows.
- The NYSE Composite Index 50-day moving average is rising.
Below you can see all of the signals mapped on a chart.

These first two conditions are the important ones. Having a significant number of stocks making new 52-week highs at the same time. While a significant number are making new 52-week lows, signals an unhealthy market. When markets are well-behaved, most stocks tend to move together. When they do not, we should be warned and either readjust or improve our trading discipline. That warning puts us on notice that for the subsequent 30 days after any observation, there is a greater than normal chance of a crash on any one of those days where the McClellan oscillator is less than zero.
A Hindenburg Omen in 2022
Market observers saw some signals of another Hindenburg Omen as the markets started to decline in January of 2022. Whether this induces another crash remains to be seen. But it highlights why it is important to keep an eye out for indicators suggesting a crash. Especially in unpredictable markets. They are infrequent, but when they occur, it can give us an early warning to watch for signs that might corroborate a decline.
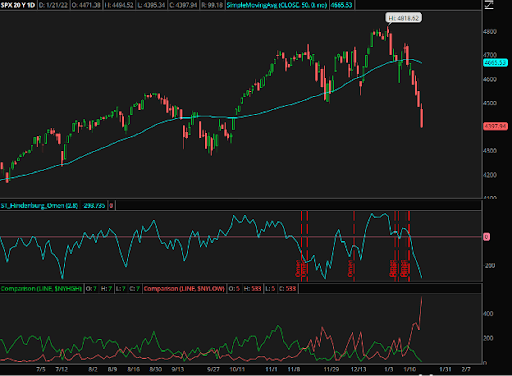
In late 2021 and again in early 2022, we saw a cluster of Hindenburg Omen observations, as recently as January 14th. That has put us on warning to look for exactly the kind of selling which we have already observed and the potential for even more. On any day when the McClellan oscillator is below zero, down moves could turn ugly.
This warning sign will remain for a 30-day period from the last observation. When significant selling follows the omen and then turns the 50-day moving average of the NYSE composite index down, as it has in early 2022. There cannot be another, fresh Hindenburg observation until the moving average turns back up. Bear markets often begin with attempts to regain a new high which fail. Often this action can set up fresh Hindenburg Omen signals for a subsequent leg down. If markets do bounce, it will be something to watch for.
There are some who say that the Hindenburg, filled with hydrogen, was destined for disaster. However, the airship traveled ten times from Germany to the United States without incident before the crossing where it burst into flames, and 36% of those aboard perished. Likewise, not every observation of the Omen ends in a stock market disaster. It is, however, a sign of a dangerous condition.
Be Ready to Spot the Signals
For users of thinkorswim (TOS), my chart layout for tracking Hindenburg Omen signals can be downloaded for your personal use.
And if you are interested in learning more about how I follow the markets and use indicators for trading. Join me and other veteran traders in the Voodoo Mastery Program. We look forward to seeing you there!

FAQs on Hindenburg Signals
Q: What is Hindenburg Omen signal?
A: It is a term used in stock trading where certain market conditions align to form a signal. For instance, it’s a warning that conditions are ripe for a steep market decline.
Q: When was the last Hindenburg Omen?
A: Traders quote 2009 as the latest year when the signal was formed.
Q: How do you calculate the Hindenburg Omen?
A: “In order to determine whether a Hindenburg Omen may be happening, it is important to look at these four criteria: the number of new NYSE 52-week highs is greater than 2.8% of all unchanged issues, the number of new NYSE 52-week lows is greater than 2.8% of all unchanged issues, the number of new 52-week highs is not more than double the number of new 52-week lows, and the NYSE Composite Index 50-day moving average is rising.”