
In this post:
-
- What trading indicator shows momentum/trend moves well before they occur?
- When do momentum divergences happen?
- Which moving averages do traders pay particular attention to?
It seems like the stock market is no longer subject to gravity. The higher it goes, the higher it goes, and it has been a historically long time since we have seen any significant pullback in the market.
But, like all things, eventually what goes up must come down. We have questions as traders. When will the market retreat? What could possibly crack the unstoppable, debt-fueled bubble market in front of us?
While I don’t have the answer for you today, I have an idea of what might have to happen for a drop. At this point, it seems like it will need to be an external catalyst, a black swan of sorts, that would put a pin to the bubble.
However, as traders, we cannot anticipate these things. What we can do is see and weigh the evidence in front of us.
At the moment, I am seeing a trifecta of problems for the markets as they sit at new all-time highs.
This is not to say that the markets have topped, and as of writing this I have zero short exposure; however, I think it’s important to share what I see.
The first problem I am seeing is a major momentum divergence into the recent highs. Momentum divergences happen when prices go higher while the momentum indicator goes lower.
This doesn’t mean a reversal is imminent, but it does show an unstable market condition that typically resolves with reversion to the mean.
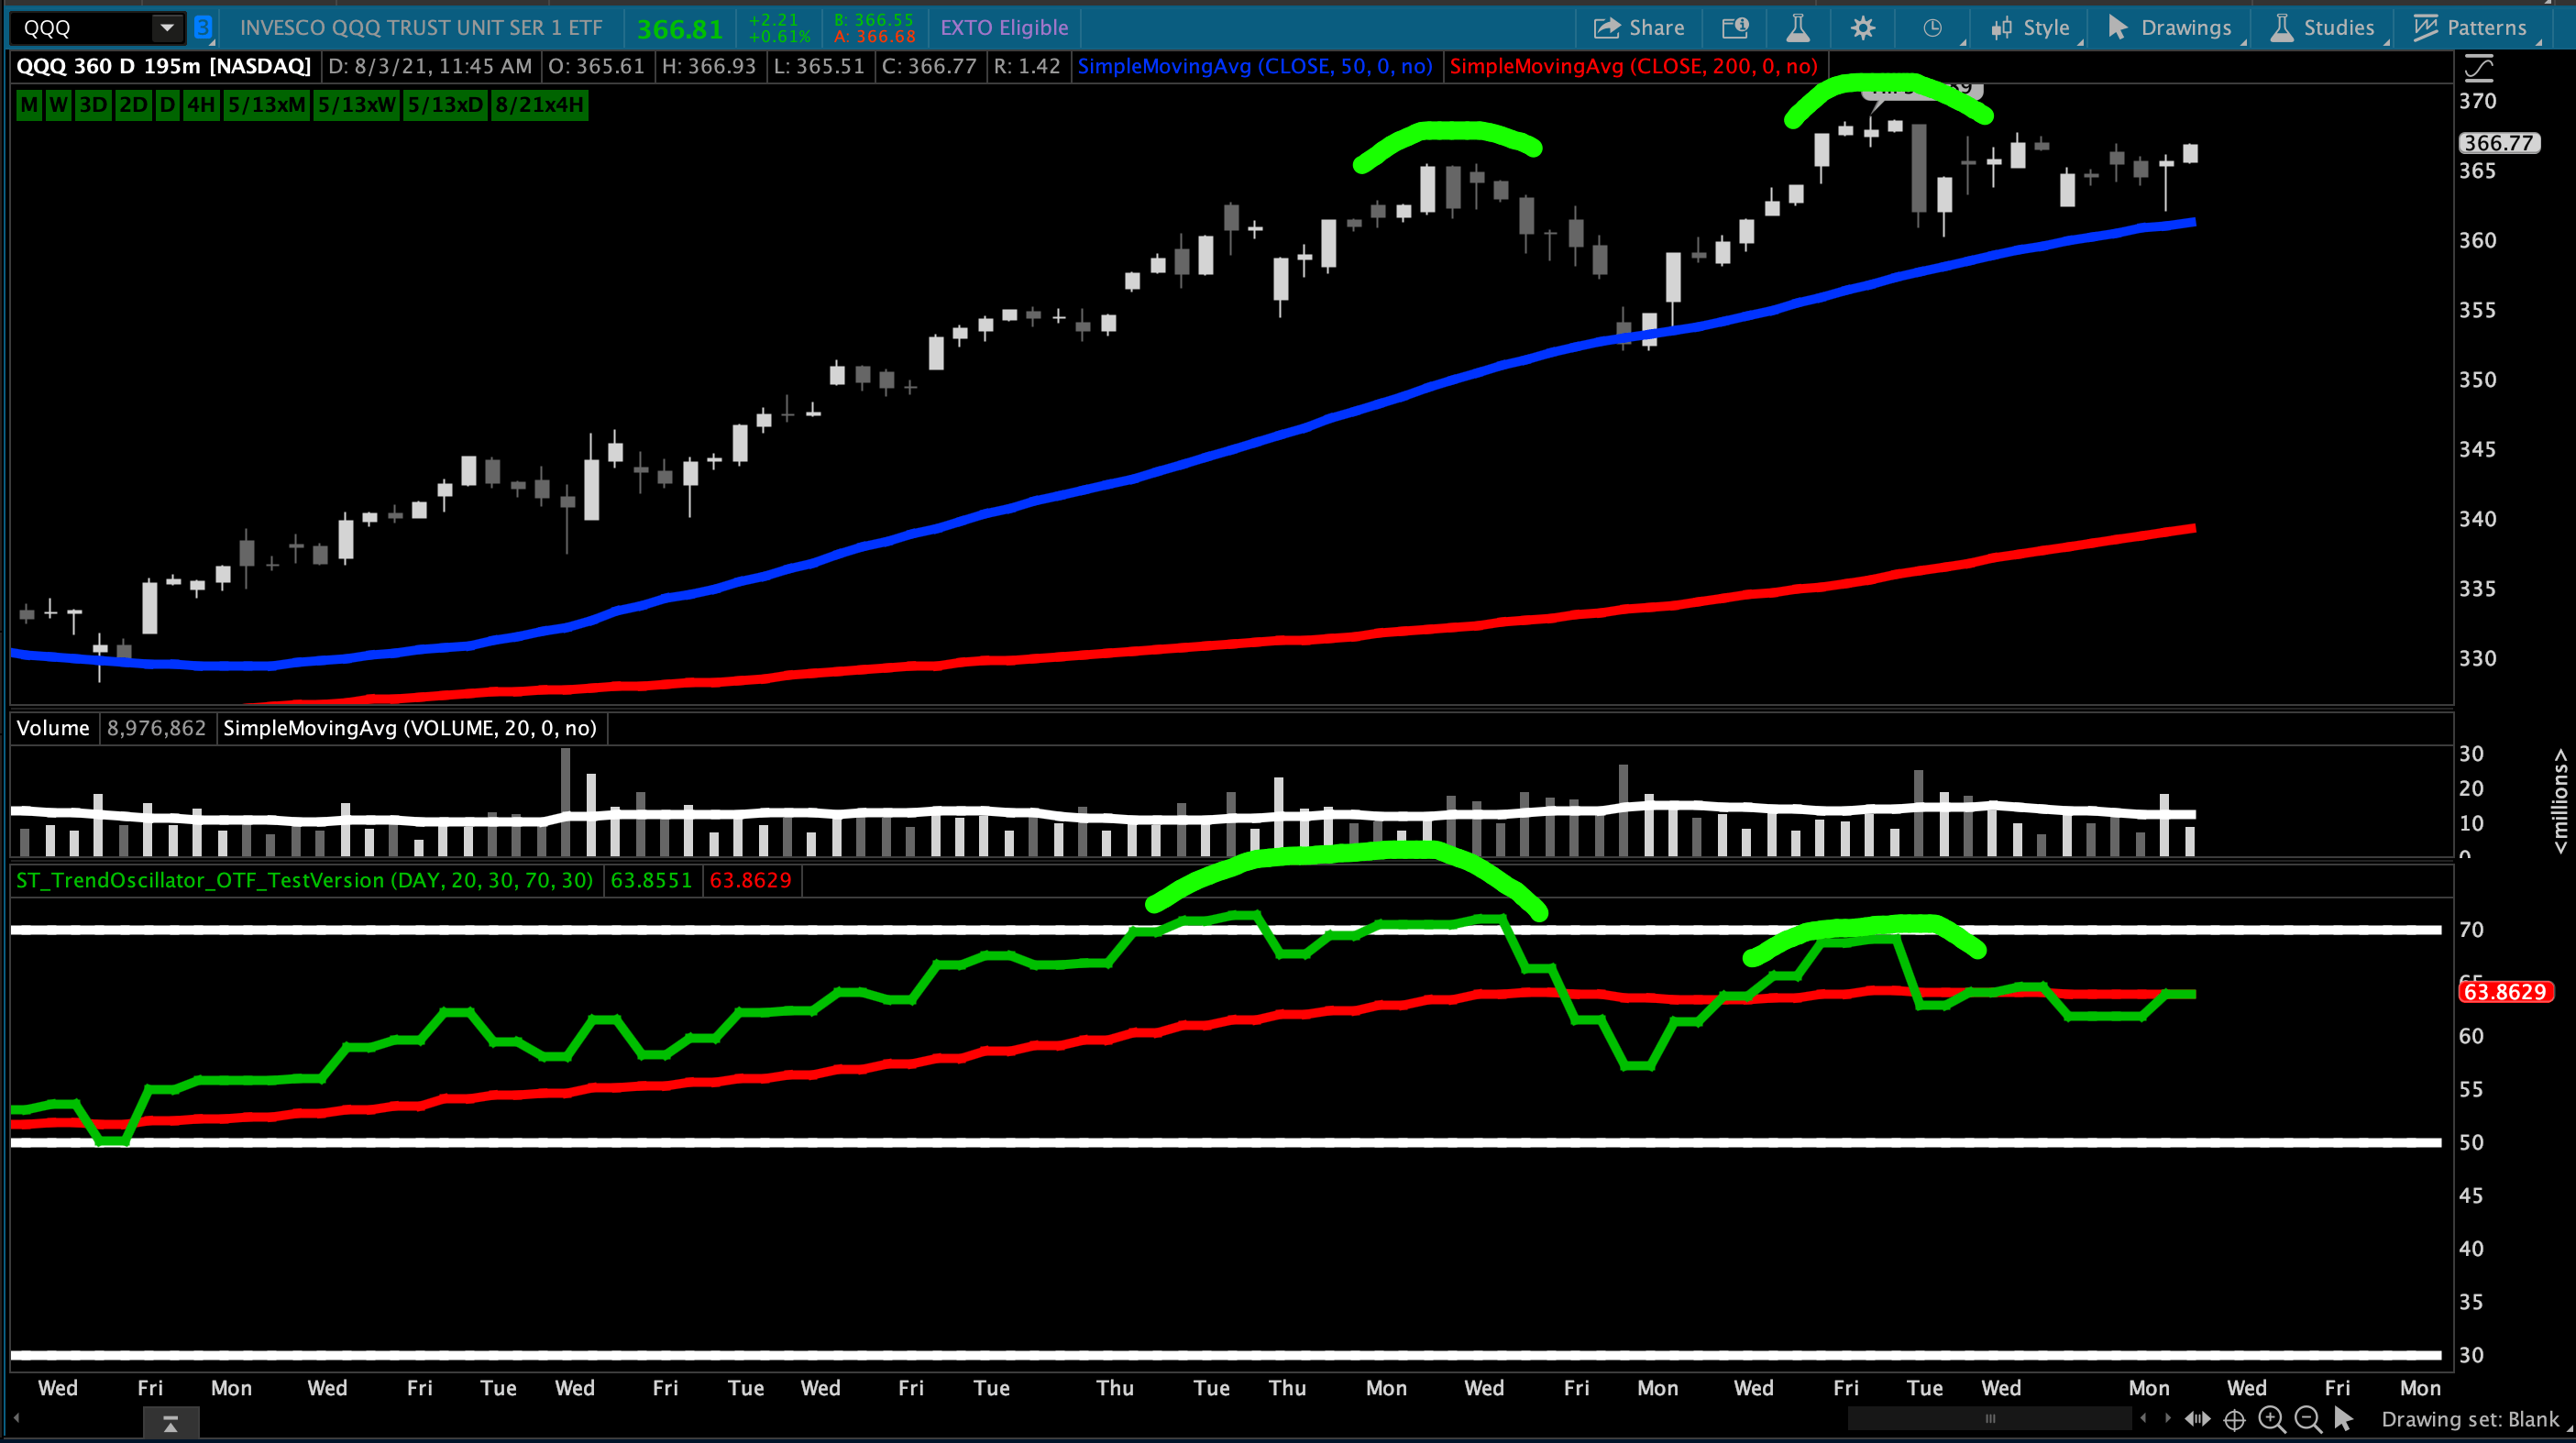
The example above shows the divergence on the QQQ technology sector. However, this divergence is found everywhere in the market on all indices and sectors, which is why it’s important to wait until it resolves… either with a fresh momentum high to justify the new price highs or a pullback to the mean.
For now, structure remains intact and the bias is higher… However, the divergence creates a bit of a dark cloud over the action until it is resolved.
The next signal is based on my own indicator, the Trend Oscillator. This indicator has a habit of showing coiled up momentum/trend moves well before they occur, and when it does it looks exactly like this (image below).
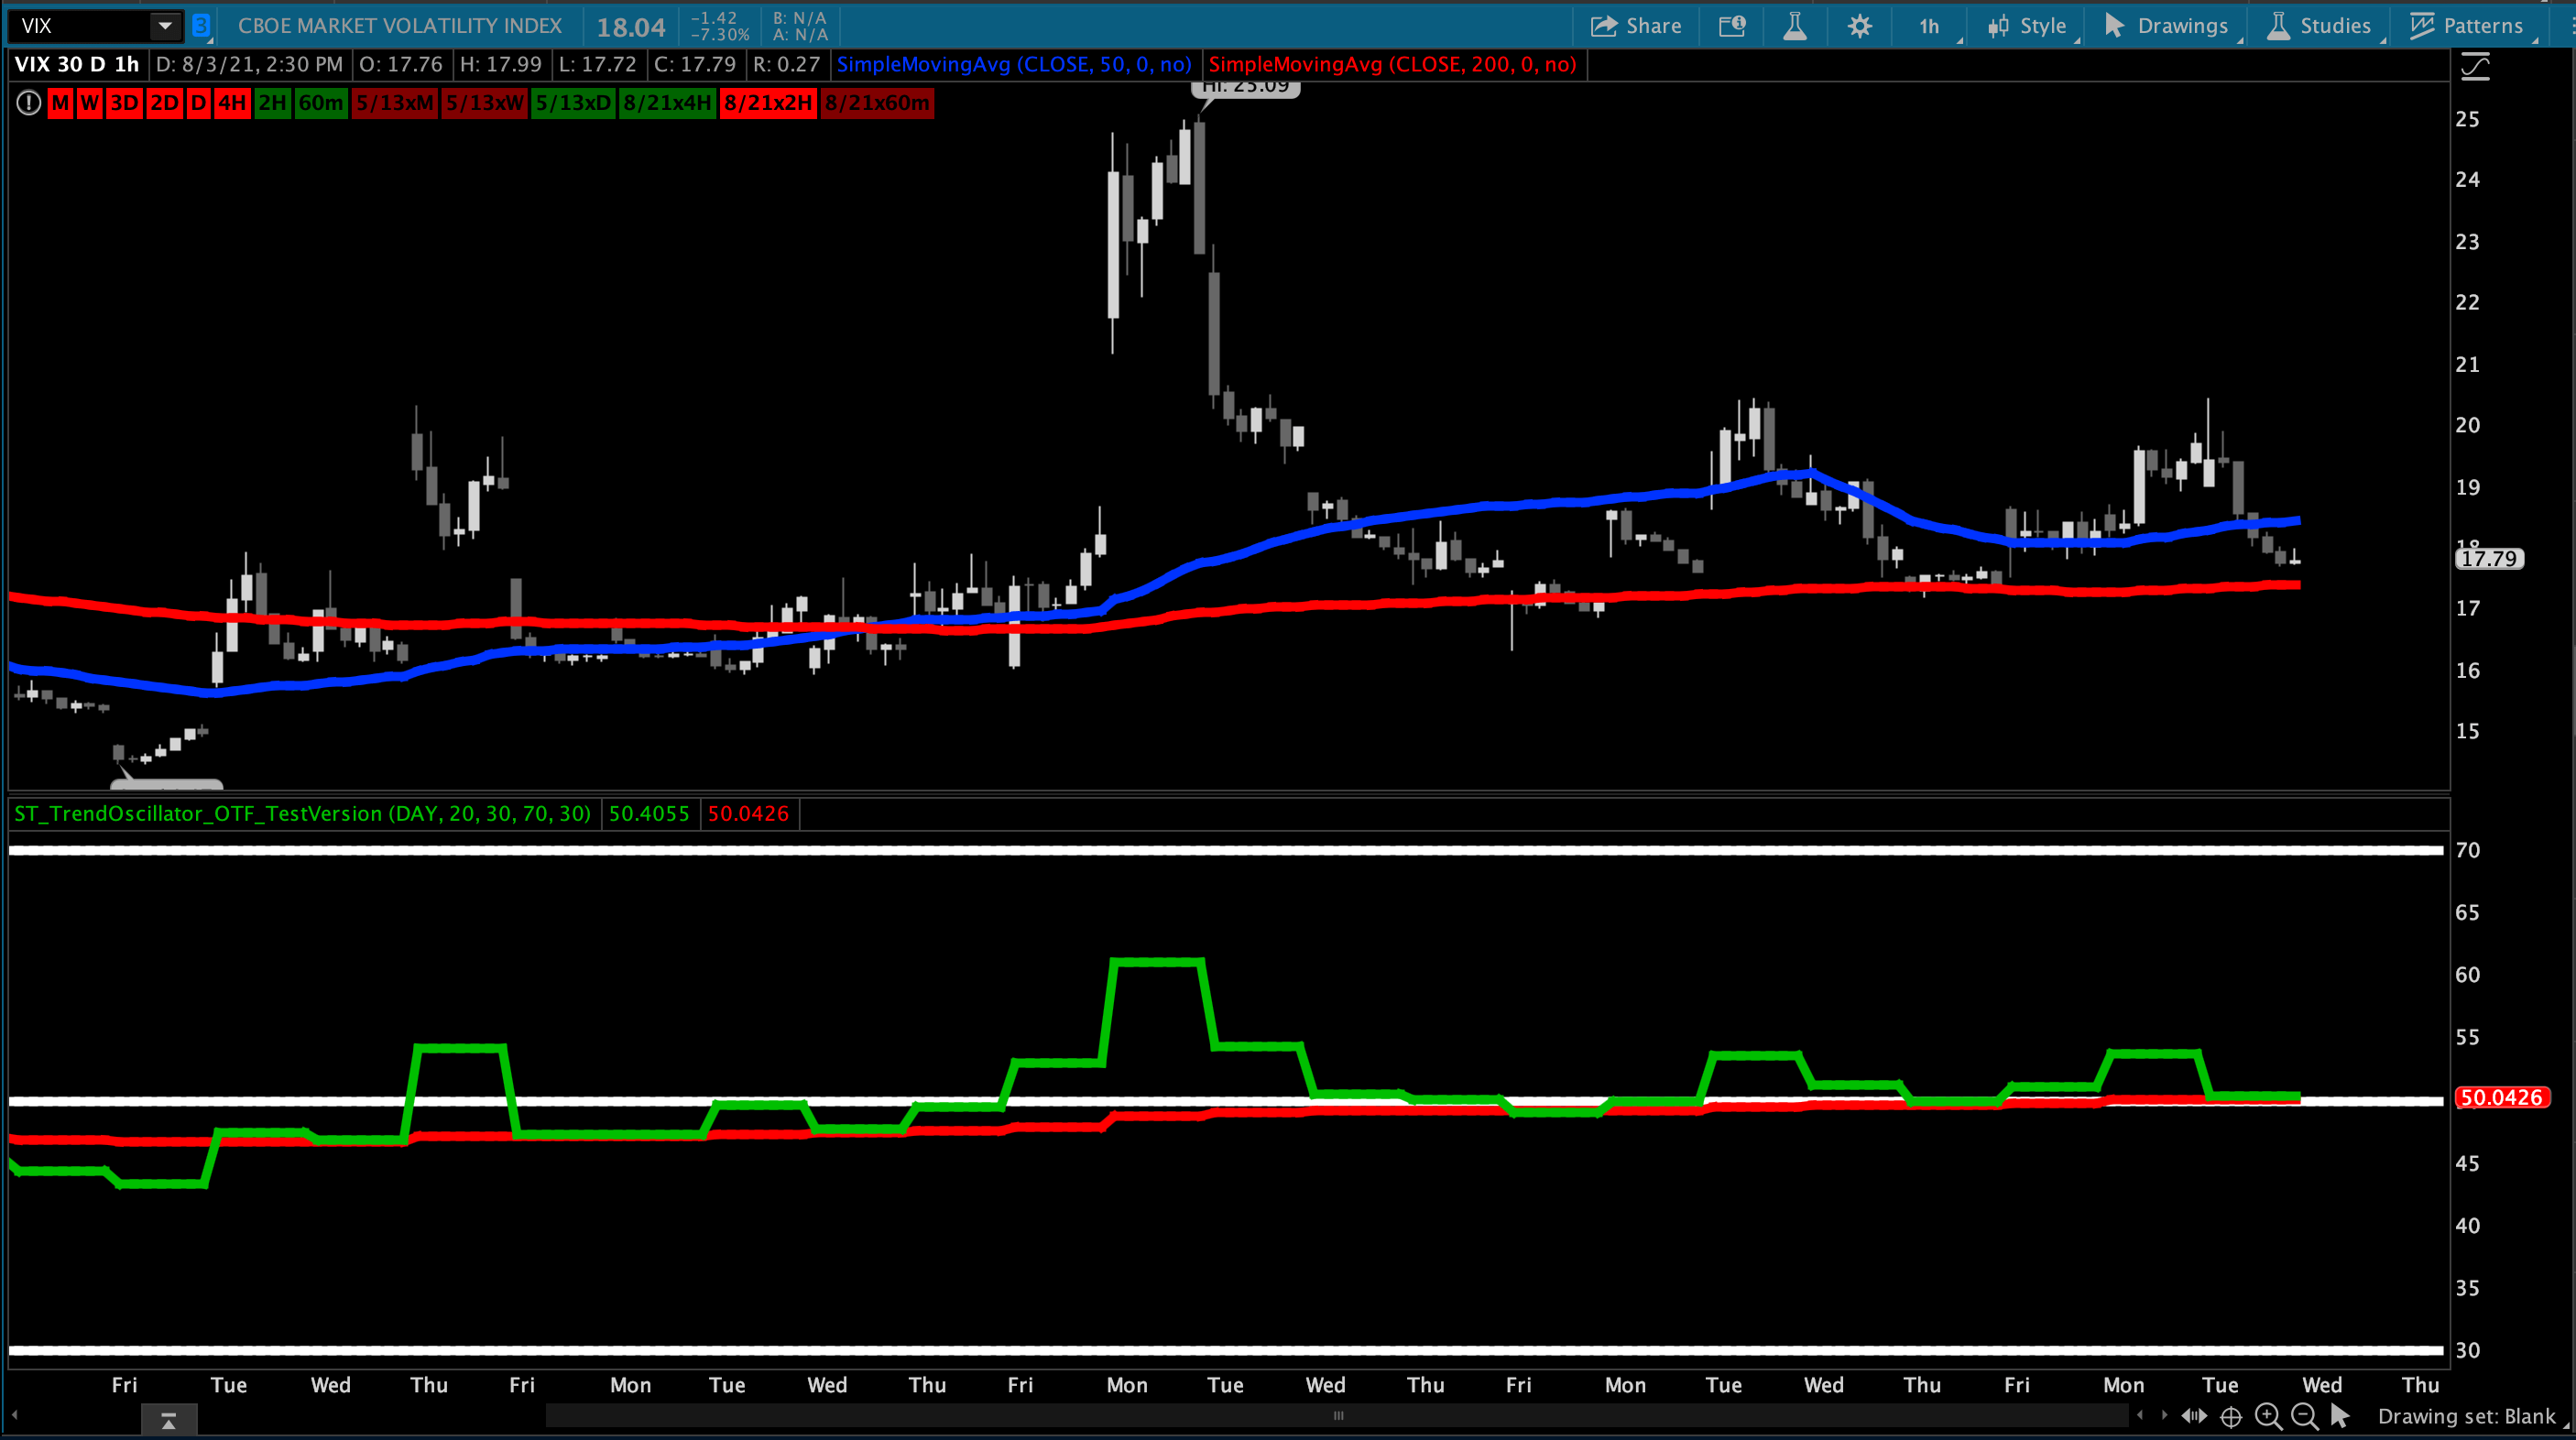
The example above is an hourly chart of the VIX (Volatility Index) for the past month. Observing price, we can see the VIX hasn’t really gone anywhere. It has traded in a sideways range for the duration of the month.
However, the Trend Oscillator is clearly showing a positive bias, where the green line is above the red line and both are climbing and now both are above zero (50).
This is an imbalanced position. The indicator is showing more momentum than the price is showing. This resolves one of two ways, either a sharp break lower… which “fixes” the positioning of the two lines… or, more commonly, a break higher as the discreet buildup of momentum fires.
Lastly, we have a chart of the internals. There are many ways of looking at internals, but I will focus on the percentage of stocks in the S&P 500 above their 50-day moving average.
As traders we like to see things trade above the 21-day moving average. At worst we like to see them above a rising 50-day moving average. What we don’t typically want to see is many stocks trading below that average.
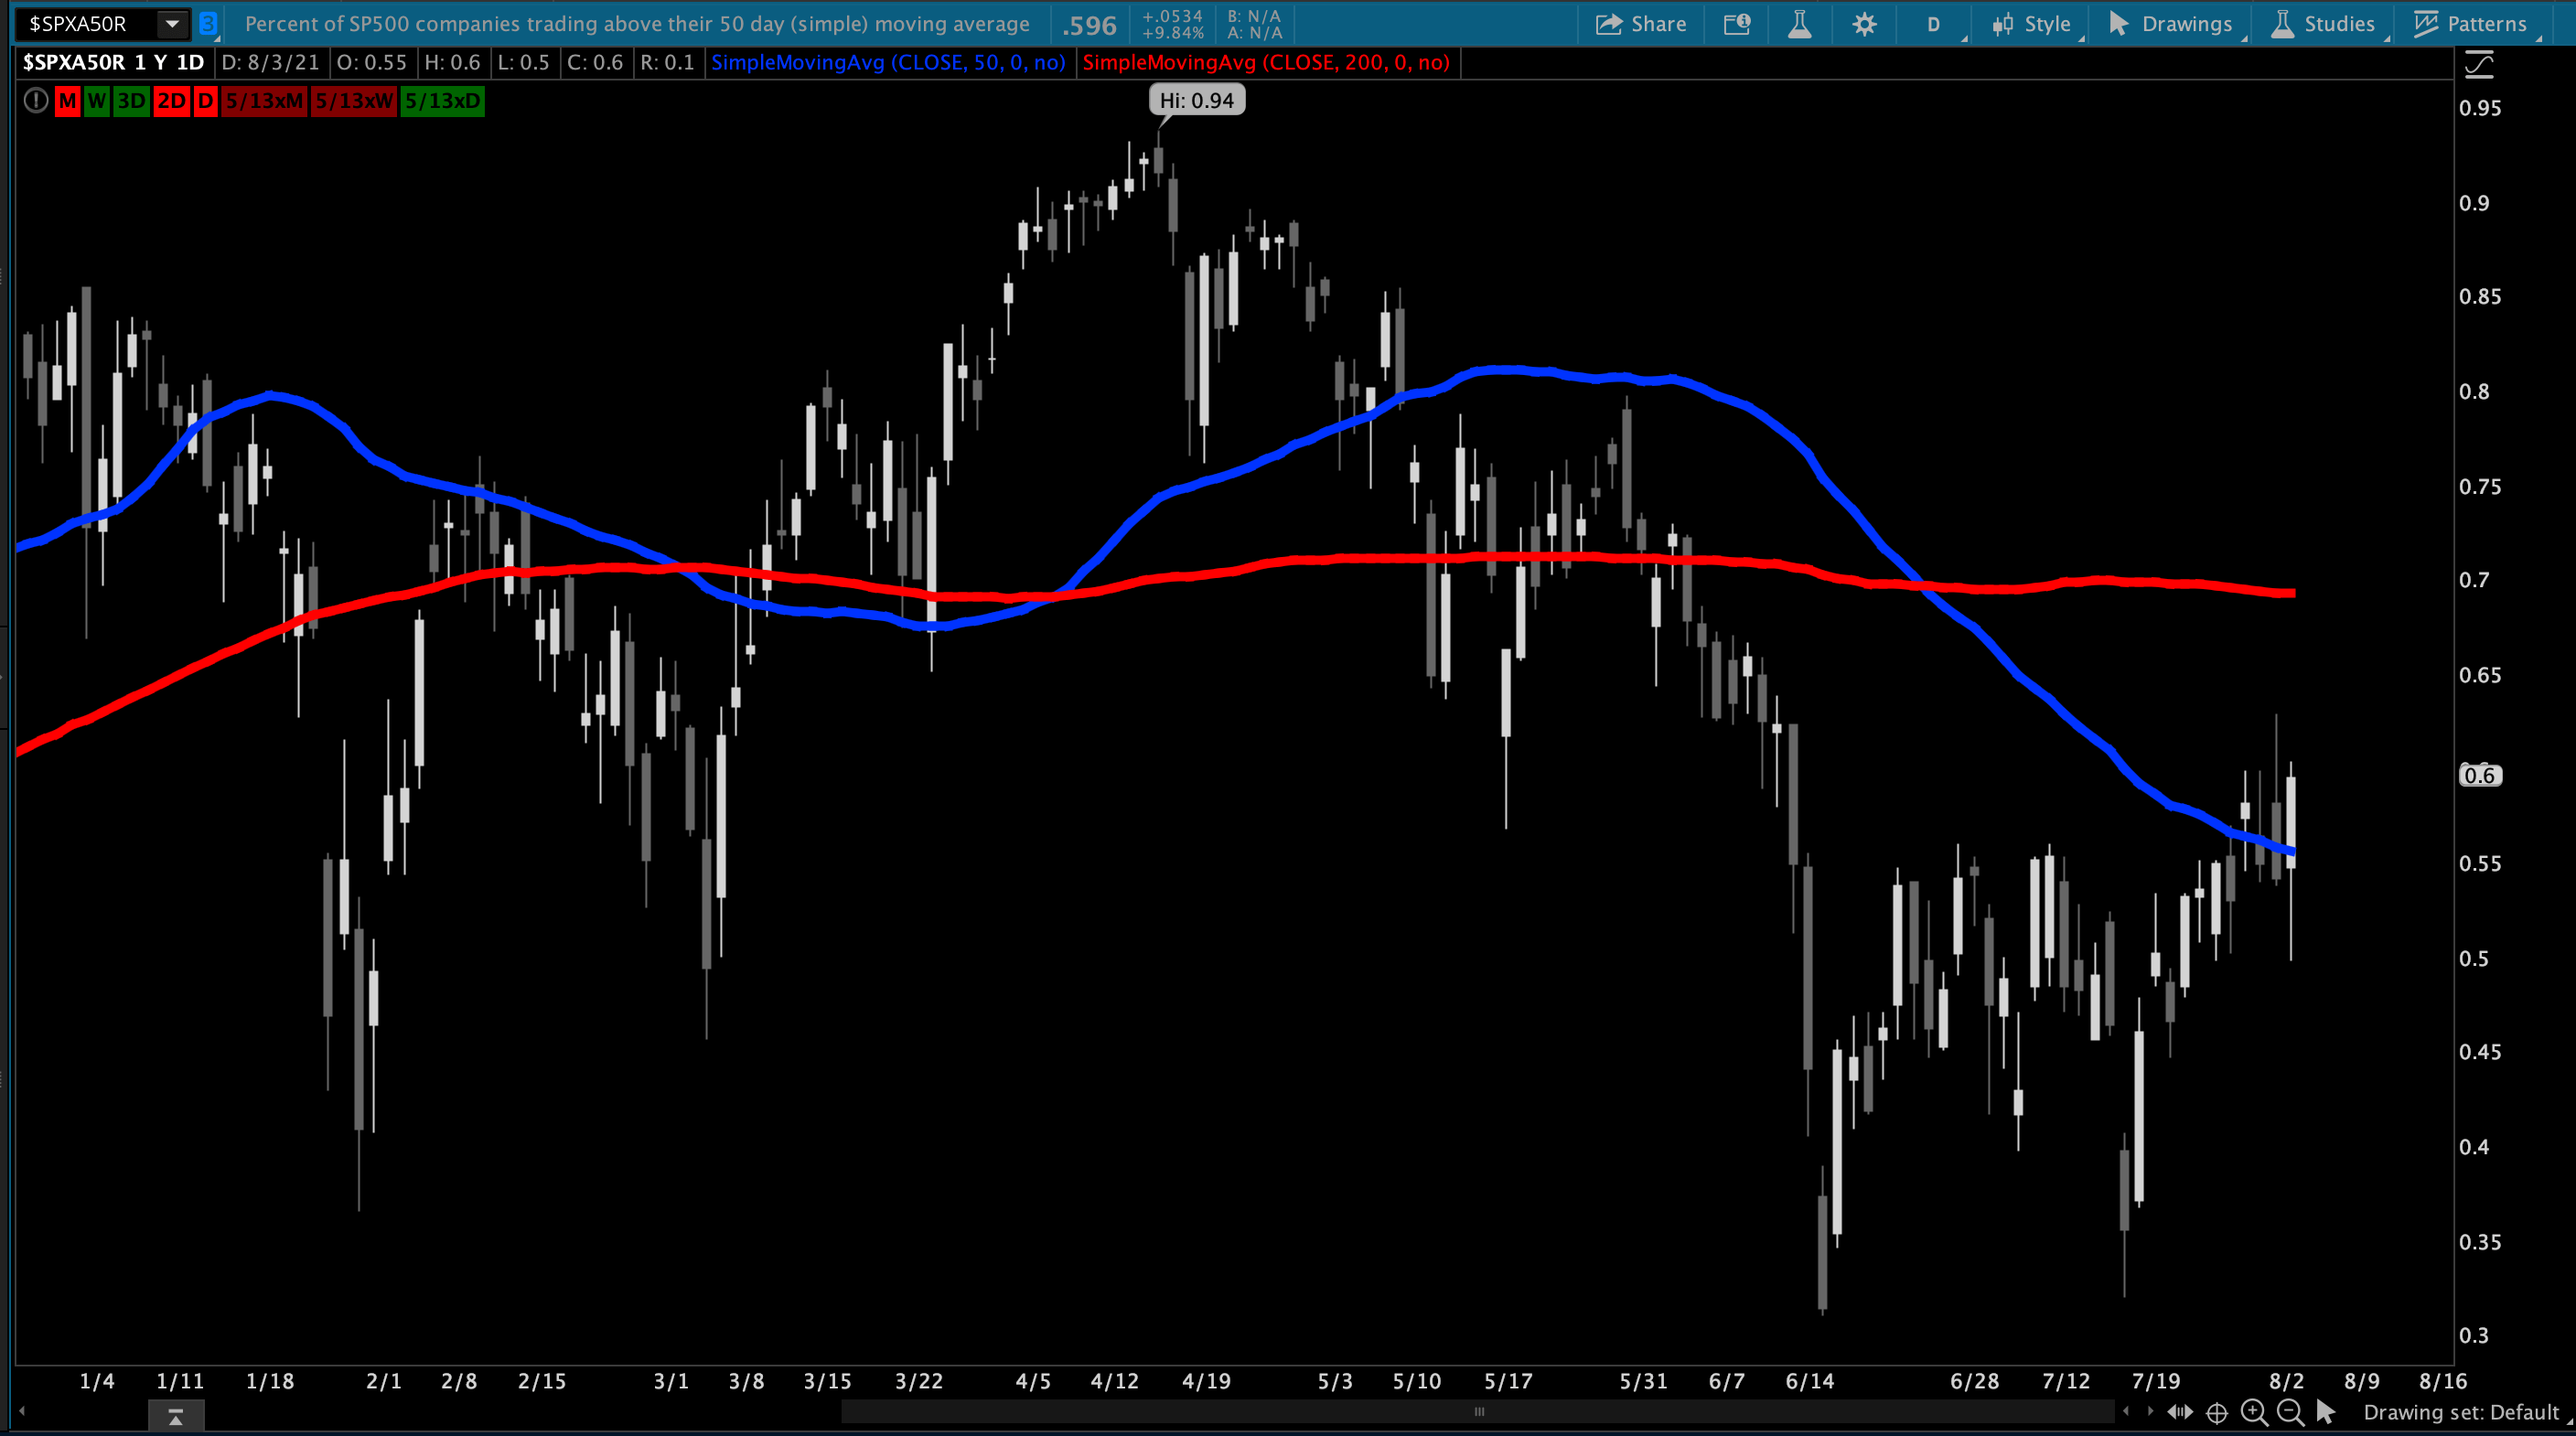
In the example above, we can see that only 60% of the stocks in the S&P 500 are trading above their 50-day moving average.
This isn’t a big deal, per say, but it does show an internal weakness or divergence relative to the all-time high prices on the indices.
Putting all the pieces together, we see a discreet buildup of momentum in the VIX.
We see a momentum divergence into new price highs on almost every index and sector.
And we see a divergence in the market internals where fewer stocks are participating in the move to all-time highs.
At the end of the day, price is king and we must wait for a price-based signal to act on these dark clouds in the market, but I think knowing these dark clouds are there is important to plan for as a trader.