
One of the most essential tools day traders can use when trading are indicators. Indicators can help traders find some of the best stocks, options, futures, and ETFs in the market. However, they are just a small piece of a large and complex puzzle known as the stock market. Using indicators alongside technical and analytical research is critical to trading.
Before using them, traders need to understand that not all indicators are created equal; some are better than others, and while unfortunate, it’s just the reality. Below, you will see the basics listed on how indicators work and what they should be doing for you.
Basics of Indicators
The essential basics of an indicator are to analyze a specific period to help traders with technical analysis. This includes but is not limited to Identifying trends, changes in volume and momentum, revealing where key support and resistance levels are, and identifying when stocks are overbought and oversold. The indicator will run through its adjustments and will gather relevant data on what the market had done.
Below is a list of what traders should consider measuring when conducting their technical analysis:
- Measure stock price – Traders should measure support, resistance, and moving averages.
- Measure a specific time frame – Traders need to be aware of mechanical behaviors and habits which affect important time frames: the opening bell, lunchtime, scheduled speeches from FOMC leaders, and the close of the market.
- Volume – the most common volume type measures how many contracts have been traded at a specific time of day. I recommend measuring price-based volume for day traders, which measures particular price points.
- The volatility of a trade is how much a stock moves in a period of time; volatility can help you determine the high or low price of a stock during a specific session.
Are you Interested in Learning to Trade?
Indicators are essential, but learning to use them during live trading cannot be stressed enough. Here at Simpler Trading, we understand what traders go through, and that’s why we have the Simpler Futures Membership, where traders can come together and trade with professional traders, get real-time trade alerts, and access our learning center. Sign up today and never trade alone.
Video Guide to the Best Indicators
The VWAP Indicator
The VWAP is an anchored volume-weighted average price; unlike other indicators that focus on price or time, the VWAP focuses on volume. The trader will want to anchor it to a specific price, increasing the accuracy of measuring volume from a specific psychology.
Standard Deviation of the VWAP
The standard deviation of the VWAP is also known as the Vscore. Sometimes volume will spike to abnormal levels, and there is a higher chance that the volume will readjust and return to the mean. Because the spiked volume has a higher chance of snapping back, traders will want to know those opportunities, and the Vscore does just that.
Day trading can have high volatility, and the Vscore can measure that volatility, giving you an edge over other traders. Other traders might just be looking at price, but traders with the Vscore consider price and the volume behind it.
The Hourly Price Movement Range Indicator (HPMR)
Throughout the day, certain times are more volatile than others. However, the Hourly Price Movement Ranger indicator (HPMR) can help forecast the volatility-based support and resistance for the hour of the market. Traders who can measure time, especially during special events or high movements such as the opening bell, lunch, and the close, will have more information to make a decision.
Priced Based Indicators
Priced-based indicators help traders measure prices on their charts. However, different variations can help traders immensely through their research. Below we will list the best tools that traders can use.
GRaB Candles
GRaB Candles are a price-based indicator that allows traders to understand the momentum and the trend based on the candle’s color. Below is a chart of the candles and what they look like being used.
- Red means that it’s bearish
- Blue means that it’s neutral
- Green means that it’s bullish

Moving Averages
In this case, moving averages are used simultaneously in connection with the GRaB candles. Above in the chart, you can see green, blue, and red trend lines. The moving averages are set at 34 Exponential Moving average (EMA), moving on the high and low close referred to as the 34 EMA Wave.
When it comes to day trading, there isn’t just one indicator that can give you the full view of the market. To have a chance of trading in the market, traders will want several indicators that work together and can give you the most up-to-date and accurate information at hand. The best indicators, in my opinion, are the VWAP, the Vscore, and the HPMR.
Paired with Price-based indicators such as the Grab candles and the 34 EMA Wave are best. Below is an example of what my chart looks like daily.
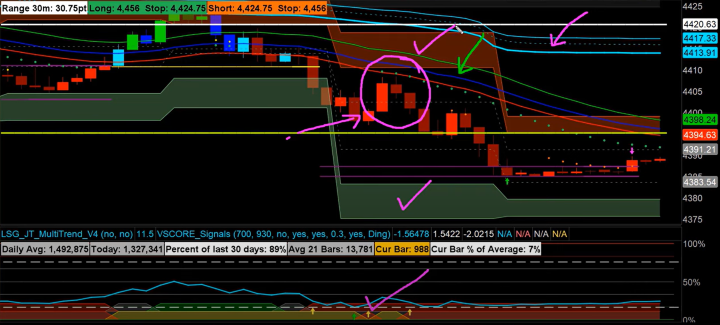
The chart above can look like a lot to deal with, but this was a brief introduction to the best indicators and why I think they are valuable. If you are looking for a more in-depth learning opportunity with the indicators I use, sign up for the Ultimate Day Trading Strategy and learn how to use the indicators with your charts today.
FAQs on Day Trading
A: GRaB candles are a trading indicator represented by painted candles that show the volatility and congestion in the market. The wick of each colored candle corresponds to the price range, and the body of the candle indicates the open and closing price.
A: Day trading is fast-paced, and that fast pace is not for everyone. Day trading can be a worthy trading style to learn. But only you can answer that question. You will need to consider how much time you can commit to research and practice.
A: Indicators are derived from historical price data and predictive tools and are a critical part of any trading strategy. They simplify price information, provide trend trade signals, and signal warnings for changes in trend.
A: If you take four or more “day trades” within a rolling period of 5 business days, you are considered a Pattern Day Trader, according to FINRA rules.
A: The 34-EMA Wave plots three exponential moving averages (EMAs) and serves two purposes: identifying a trend and understanding momentum and sentiment.
