Using EMA in Your Trading Strategy

Taylor Horton
5 min read
Every trade setup I make starts with checking out exponential moving average (EMA) lines on my charts. In my 10+ years of trading, I have come across a multitude of tools as I strive to improve my trading every day and refine my strategy. Some tools don’t make the cut, while others have become vital to my setups. EMAs are undeniably in the latter category. Let’s talk about what an EMA is and how you can use this indicator in your trading.
What is an EMA?
Moving average is the foundational statistical calculation for many of the most popular free and paid indicators in trading. In the chat rooms, we talk a lot about EMAs and SMAs on our charts. The SMA, or simple moving average, is basically the moving average calculation you learned in statistics class: it’s the sum of the average prices over the number of periods. The EMA is different in that it places more importance on the latest price data by assigning a greater weight to the more recent prices in the calculation.
So should you use SMAs or EMAs on your chart? It’s really a personal choice. A lot of times you’ll see charts with both SMA and EMA lines because each is giving the trader a different take on the situation.
The choice of whether to use an SMA or EMA will really depend on the time period you’re looking at and the type of trader you are. Given the emphasis on recent prices, a day trader may be more interested in looking at the EMA indicator because the calculation will be more time sensitive.
Also, we use different EMAs over different time periods. Shorter time periods, like the 8-day EMA, are for trading over shorter time frames. On the other hand, the 200-day EMA would likely be for long-term investors. In addition, if the time frame is longer, the weighting is less pronounced. So a shorter period of EMA will have a greater weight on recent price than a longer period.
Why is EMA used in Trading?
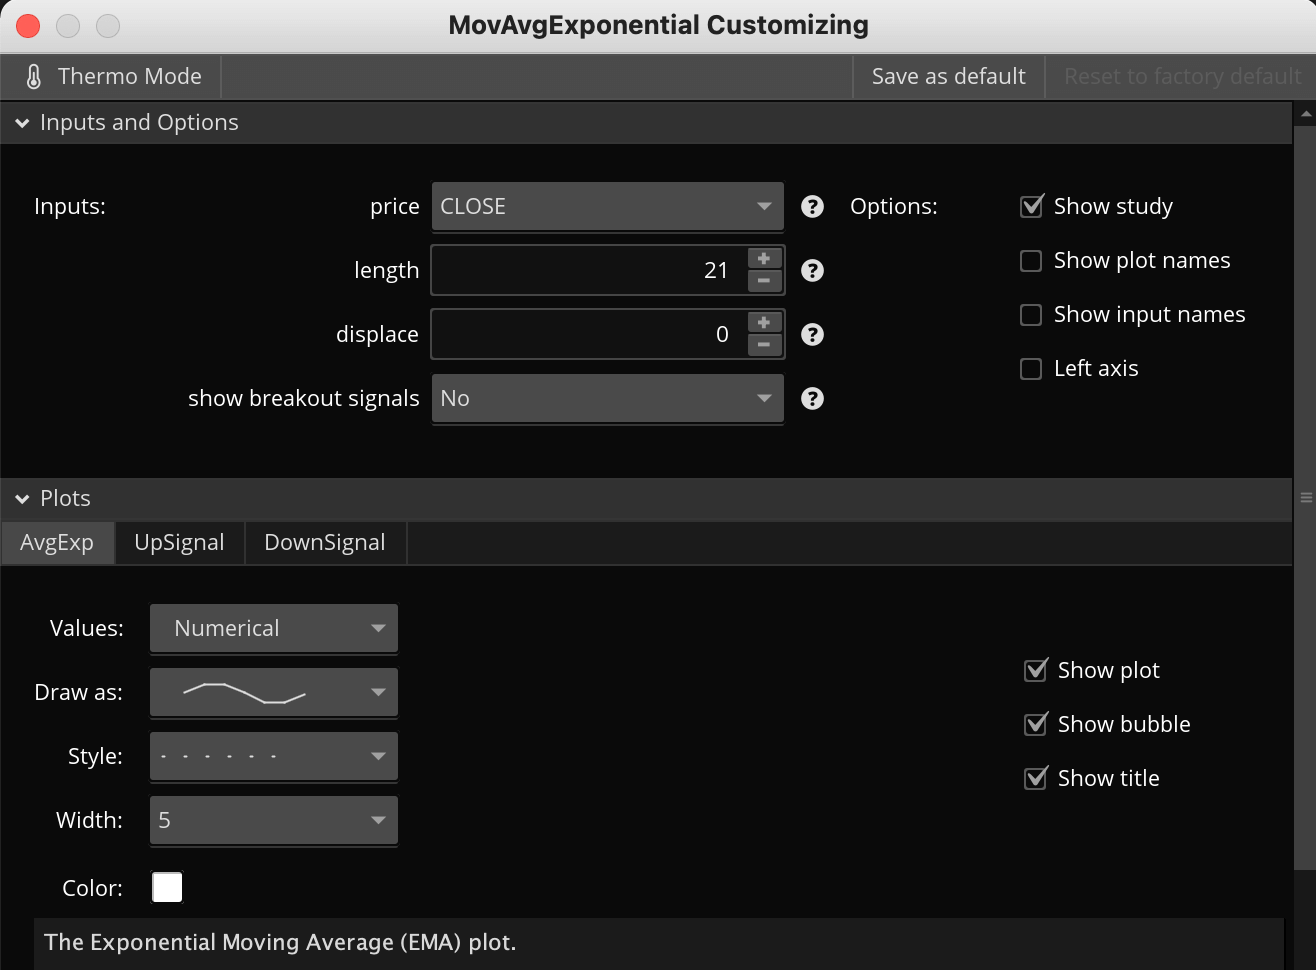
The EMA helps identify trends for traders. If the EMA indicator rises or falls it will essentially help the trader make a decision on entry and exit points for a trade. Think about the 21-day EMA (or 21 EMA) as the “the mean.” All stocks do is move away from, or back to, the 21 EMA. What you should know as a trader is that most big moves tend to start at the 21 EMA, so we can use this level as a starting point for our trades – because stocks always come back to the mean. Here are my settings for the 21 EMA on my charts:
The EMA Indicator in Trading Strategy
The concept of reversion to the mean (RTM) is one of the most important concepts to understand as a trader. If you can understand this, you can be in rhythm with the market. The premise of RTM advocates that price and historical returns will return to the mean of the entire data points of the stock. Hypothetically speaking, if the stock goes up or down, ALL stocks do is move away from the 21 EMA, and back to it.
So if we look at AMZN here with nothing but the 21 EMA, it made a powerful move off of the 21 EMA and then abruptly pulled back to it. The move away from the 21 EMA is the move we want to catch.

The concept of reversion to the mean can also give us a healthy perspective of a trend, and the ebbs and flows of the market. A pullback to the weekly 21 EMA may look ugly on a daily chart, but it’s just a healthy reversion to the mean in an overall bullish trend.
So this is where it all begins, my friends. The 21 EMA is where powerful moves start, and we want to catch the move AWAY from the 21 EMA, and take profits BEFORE we revert back to it.
To break it down simply:
Long Setups: Build position in the buy-zone @ the 21 EMA
Short Setups: Build position in the short zone @ the 21 EMA
When a Squeeze forms as a stock trades near its 21 EMA, there’s a higher than average probability of a bigger than average move just around the corner (only if the setup fits the rest of our checklist, of course). The squeeze is what helps identify when there’s a growing probability of that move off the 21 EMA happening, BUT we need guidelines to confirm our position, know where to take profits, and determine what position size to have on.
FAQ
A:Moving average is the foundational statistical calculation for many of the most popular free and paid indicators in trading.
A: The EMA helps identify trends for traders. If the EMA indicator rises or falls it will essentially help the trader make a decision on entry and exit points for a trade. Think about the 21-day EMA (or 21 EMA) as the “the mean.”
If you want to learn my guidelines for setups off of the 21 EMA. Then check out my Compounding Growth Technique course, where I teach my bullish/bearish checklists and guidelines based on my favorite trading setup criteria.
