How To Use Volume To Improve Trading Success

Mary Ellen McGonagle
4 min read
When I’m scanning for stocks poised to far outpace the broader markets, I have a checklist of characteristics that these stocks must possess.
Is the company in a growth mode with strong year over year earnings? Is it in a strong industry group where other stocks are rising higher than the markets? The stock’s chart pattern is also going to be important as I’ll need to see it trading above resistance and ideally, emerging from a sound base pattern.
While all these traits are highly important in uncovering the next big, winning stock, there’s one key component that investors often overlook when putting their money to work. That is, whether the stock is under strong accumulation. In other words, is the stock moving higher on heavy volume? Using volume as an indicator can greatly improve your success trading stocks.
What Is Volume And Why Does It Matter?
The reason you want to see higher volume than average as your stock advances, is because this means investors want in. And most likely, it’s professional money managers with enormous buying power that are accumulating a position. This increased activity will help propel your stock even higher.
It’s not just heavy volume that you’ll want to see however, as you’ll want the stock to be either reversing a downtrend or breaking out of a sound base such as the example below. Farfetch (FTCH) went on to gain 131% after I entered the stock in late October of 2020.
The high volume on its 10-week base breakout not only got me in the stock, it kept me in as the stock climbed to new highs while under strong accumulation.

How Volume Can Improve Your Trading
Screening for high volume as stocks decline can be equally powerful, as institutions want out and their enormous selling power will push a stock much lower. In this case, you’ll want to note when your stock is breaking below key support as in the example below. As Paycom Software (PAYC) broke below its 50-day moving average on heavy volume in January, it was time to exit.

When screening for high-volume events, you’ll want to look for an activity that’s higher than the average daily volume over the past 50 days. Simply eyeing the volume on your chart can be equally telling as highlighted in the 2 charts above.
My Volume Trading Strategies
I regularly use high volume to pinpoint my entry and exit points for stocks. For instance, after a stock gaps up on heavy volume, I’ll buy the stock on a pullback to its 5-day simple moving average.
However, if the stock breaks below its 50-day moving average on above average volume, it’s time to exit. The chart of Nike (NKE) below, highlights these characteristics. The high volume coupled with the chart action, provides me confirmation of a continued move.

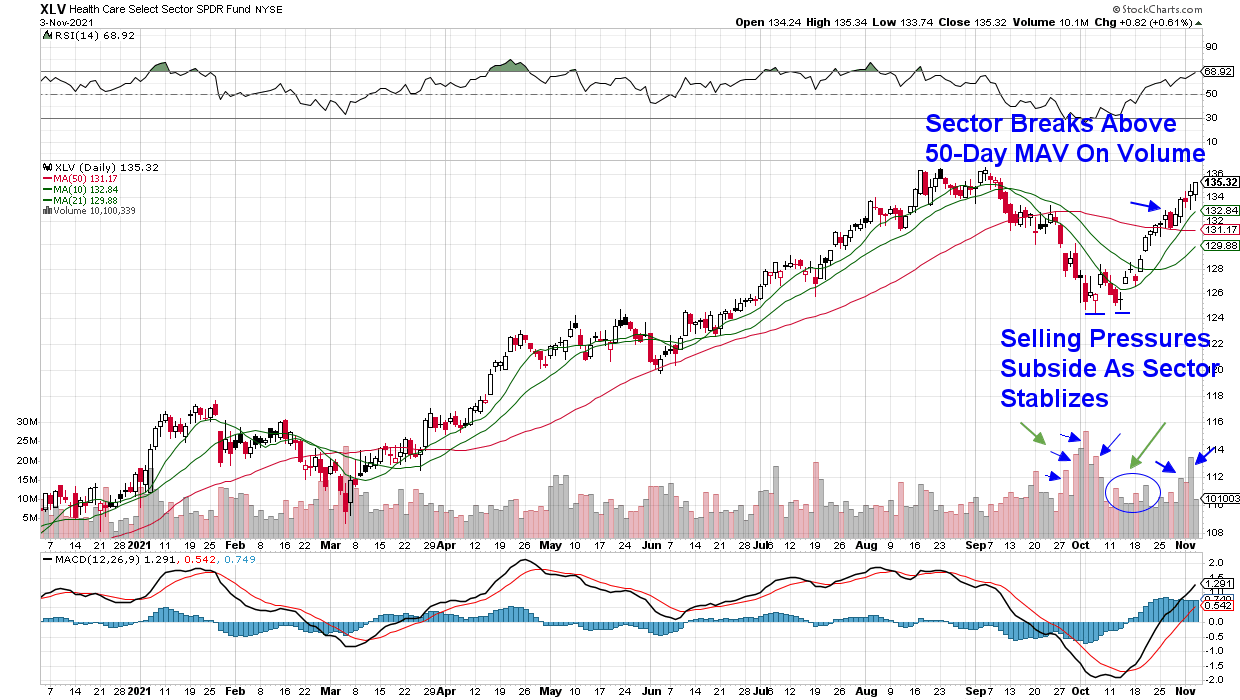
This strategy can be used to spot Industry Group or Sector rotation as well as volume which indicates that the underlying stocks in that area are under accumulation or distribution. Take a look at how I was able to spot that the Healthcare sector (XLV) was coming back into favor in the chart below.
In mid-October, the selling that was occurring on very high volume subsided which allowed the sector to stabilize. When heavy volume picked up again, it was when Healthcare bullishly broke back above its 50-day moving average and into an uptrend.
Adding this simple, yet powerful tool to your investing system can be a real game changer. I’d like to educate you on other key drivers of a stock’s price movement, and urge you to take a 4-week trial of my bi-weekly MEM Edge Report for a nominal fee. You’ll also be alerted to individual stocks that are poised to take off by using the link below.