How to use Options Charts
To effectively trade in the stock market, traders need to use charts. It’s such a fundamental part of trading that the concept is often overlooked. However, I want to ensure that you’re not missing out on one of the most accommodating charts that can be used during your trading sessions, and that’s the use of options charts. The options chart is a tool that I constantly use, and it has enhanced how I research stocks to trade.
It helps me gauge the strength of a stock trend or breakout by comparing the stock charts to the options charts. However, options charts don’t get the attention it deserves, so I want to take a few moments to shed some light on the power of using options charts. Options charts can benefit traders in almost every aspect of their trades, especially those who primarily trade options or stocks. This simple-to-understand yet underrated tool can strengthen any trader’s technical research and the resulting trade setups.
What are options charts?
The options chart is a graph that shows traders and investors the market price of options over a given period. The options chart is essentially a stock chart with options instead of stocks. Traders can monitor options prices in the same way as a stock chart. Options charts represent how certain options positions are trending.
Traders can see the highs, lows, and the chop just as they would with a stock chart. Traders that know of options charts utilize both types of charts – options and stocks – to compare and contrast the positions and momentum behind specific market trends.
Sign Up for the “Max-Out Your Trade” Class
Risk management and having a strategy are crucial to trading in the market. If you are curious about how I trade options then consider joining me in my pre-recorded class “Max-Out Your Trade.” I will go over my favorite indicators, the strategy I use, and the patterns I look for. Sign-up today and learn the way I trade.
How to Set up an Options Chart
Setting up options charts isn’t especially hard, but traders will need to know how to navigate the trading platform they trade securities on to set up the options chart. One of the reasons we are partial to thinkorswim© at Simpler Trading is the versatility it offers to traders. There are several ways to customize the platform to fit your specific trading strategies and setups. Setting up options charts is one of the features this platform offers.
Below are the instructions for setting up an options chart in thinkorswim©:
- While in the program, open another chart. It should bring up a blank chart.
- Go to the options chain to find calls and puts. (This step may vary).
- Pick the option you are interested in, right-click, and then copy the option.
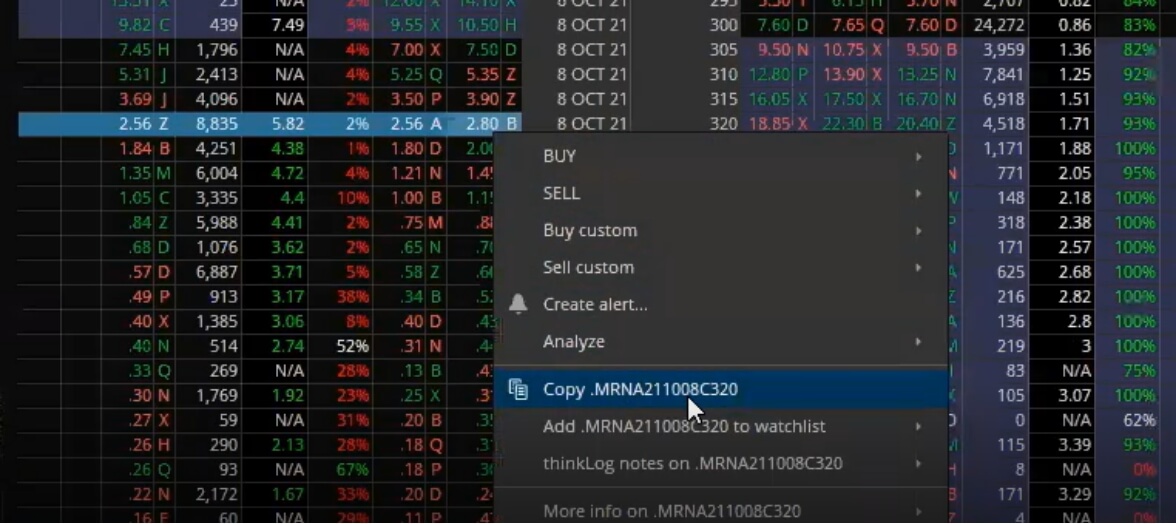
- Exit out of the options chain and return to the blank chart.
- Look in the ticker’s search bar and paste the options code into the search bar.

Once these steps have been completed in thinkorswim©, you should be able to observe the options contract that you are interested in – the same way that you would a stock position.
You can see the price movement (up and down), the trend, and the volume behind the options contract. The options chart is a valuable and accessible tool that should be used by serious options and regular stock traders alike.

How to Keep Track of Options?
If you don’t know how I trade, I take the time to conduct a lot of research on the stock market. One of the things that help me keep my research organized with the options I am interested in is an options watch list.
This allows me to pick multiple options and keep track of promising prospects more efficiently. With the thinkorswim© trading platform, traders can link the options they are interested into a chart. I can click on the options and efficiently pull up the chart to conduct my technical analysis.
How to Read Options Charts
Since I’m a day trader, I read options in specific time frames on charts. I have found the time frames that work best for me, and my strategy is the one-minute and three-minute options charts.
The one-minute and the three-minute time frame paints a solid picture of the information I look for when I trade. I will discuss the time frames I use later in this article.
When I look at options charts, there are a few simple things I look for:
- Patterns
- Low of days hold
- Support and resistance
- Higher lows and lower highs
- Wedges
The advantage of using options charts is that they can tell me exactly where the intraday support is and make a decision based on that information. In the example below, I am using Moderna (MRNA).
I had a bearish take on MRNA, but you can see the value options charts bring in this example. The chart shows how the options would dip and then pop higher when the option gained support with high volume.
This chart shows how the option trend formed a wedge where the line is drawn. The stock dipped lower, but as the option gained more and more support, you can see a massive breakthrough. The volume builds and propels MRNA to go from $3 to $8. In this case, the option acts like a stock. Traders can buy off support, sell at resistance, and play the breakout of the option.

Options Charts in Trading
Using options charts in your trading can be a powerful tool. It can show traders the market possibilities, giving them more confidence in their decisions.
Traders can find great entry points through basic patterns when utilizing this strategy with their technical analysis. The importance of options charts, their setups, and knowing how to read the charts can’t be stressed enough. Let’s look at some trading examples that use options charts so you can see the power behind them.
Using Options Charts to Find Great Setups
An options chart can be an effective means to find and confirm solid breakout moves. When conducting your technical analysis, you may often see a setup that looks perfect. You can compare that setup to the equities chart confirming and validating the perfect setup.
Using the SPX chart in the example below, we have an option from $0.80 to $16.00 on a simple wedge pattern.

This stock didn’t do anything spectacular all day. But, it formed a wedge pattern, which is a classic example of a breakout pattern. As soon as the option gained volume and momentum, the stock rallied and shot straight up in classic breakout fashion.
Traders should include gaining experience in researching options charts. This skill should be in each trader’s routine to conduct their technical analysis. The charts can reveal things traders would never see on the equity charts. They help traders trade defensively and establish solid setups like the example above.
Using Options Chart to Mitigate Losses
If nothing else, options charts can help protect traders from making bad decisions. Sometimes traders may look at a stock chart and see a huge breakthrough. Traders may quickly pull the trigger on such a position, but traders should validate the breakthrough.
It can be challenging for traders to remember that stocks can have false breakouts because they seem tempting to trade. The options chart can help traders from trading stocks with a false breakout. In this example below, two charts can showcase what I mean by this.
The SPX stock chart is on the left, and the SPX options chart is on the right. Both charts trended higher. You can see the stock had a higher high on the SPX stock chart (on the left). But, it gave a warning sign on the options chart (the right chart). On the stock side, it broke through. Yet, the options side didn’t go as high, giving its first indication that the stock wasn’t going to do well with a lower high.
Final Thoughts on Options Charts
An options chart can be a great market indicator for your technical analysis. It can help you find the perfect setup, show you if a trade is viable, and assist in mitigating your trading losses.
However, just because it’s an excellent research tool doesn’t mean this is all you need when trading in the market. You will still need to research the stock charts and focus on your indicators, but analyzing the options charts can strengthen your research.

However, if you are looking for an opportunity to learn how I day trade options, then get a more in-depth look by signing up for the “Max-Out Your Trade” class. In my pre-recorded class I will cover the strategy that has helped me in my trading career.

FAQs on Options Charts
A: An option is a contract that enables the buyer, the right to buy or sell an underlying security such as stocks. However, the buyer is not required to exercise their right to buy or sell.
A: An options chart is a tool where traders and investors can conduct technical analysis of the market price of options over a period.
A: Traders can utilize options charts by analyzing the options charts to find entry points and trading patterns. Traders can observe the options chart and the stock chart to have a better understanding of what they are researching.
A: Traders can help confirm breakthroughs using the options chart and checking to see if it’s a valid movement in the stock chart.
A: Yes, however, every form of trading has risk associated with it. I prepare by conducting a lot of research in the market and keep organized with a watchlist of the prospects I run across.
