Best Indicators for Swing Trading
What are the best indicators for swing trading, and why is this important?
Traders typically embrace different trading strategies that work for their lifestyle and risk profile. Day trading, scalping, trend trading, and position trading have positive features and varying risk factors that work well for different types of traders in different scenarios.
While day trading takes the seat as the most popular trading style, swing trading has also become a popular strategy that traders regularly use. Swing trading offers a versatile approach, especially for traders who don’t have constant access to trading charts. Many traders can’t sit by a computer throughout the day, looking at charts and formulating precise entry and exit points. Swing trading provides an excellent option for traders who cannot watch stock charts all day.
Swing traders can review the markets on their own time, check their analytical and technical tools, and decide whether they think a trade will be prosperous. Swing trading can be more forgiving than intraday trading, especially if a trader gets in or out of a position too early or too late.
With a solid strategy and setup, a swing trader can be in a trade from a few days to several weeks. Along with the versatility of swing trading, many tools can help swing traders monitor their positions, making it an appealing approach to master. So, let’s get into what those indicators are so that you can swing trade with confidence.
What is Swing Trading?
The main objective of the swing trade is to capture a profitable price movement in a stock over a few days to a few weeks. Unlike the intraday trading strategy, there isn’t a hard-defined timetable that a swing trader should abide by; it’s ultimately up to the trader. Swing traders remain in the trade as long as the trade is still profitable. Many swing traders look at 4-hour, daily, and weekly charts and then take trades off the signals from those time frames.
Swing trading is an adaptable method of trading stock that allows technical traders and investors to save time by utilizing these techniques. Technical swing traders use technical analysis to research their positions. Technical analysis relies on indicators that consider the charting of trading activity, such as price movement and volume of stocks.
Longer-term investors examine their stock picks under an entirely different operation called fundamental analysis. Fundamental analysis is when an investor analyzes a stock by looking at the company’s financial sheet for a potential stock trade.
The key metrics that investors look at:
- Free Cash Flow: This is the company’s overall profit minus its operating expenses through its operation. Free cash flow is an essential metric an investor can review, as it signals how a specific stock can be profitable.
- Price-to-earnings ratio (P/E Ratio): The P/E Ratio helps investors understand the stock’s market value and whether or not the company’s stock is over or undervalued.
- Debt-to-Equity Ratio (D/E): The D/E tells the investor how much the company is in debt compared to its equity. A high amount of debt can be a red flag, as a high hold on debt can indicate that their primary form of financing is taking loans. If cash flow falls short and the company hit’s hard times, it may not be able to make its debt obligations.
Technical swing traders may consider fundamental analysis when placing a trade, but ultimately they rely on their technical charts and setups.
Technical swing traders are sophisticated players in the market who have a deep understanding of the stock charts, patterns, and trends.
Swing Trade in the Free Trading Room
Trading can be risky, but if you are interested in trading strategies like swing trading and want to apply them to the market, consider joining us in the Simpler Free Trading room. Simpler Trading has an online trading room for traders curious about this service, but now you can find out for FREE. Sign up today and trade alongside a professional; why trade alone when you can trade with us.
What is an Indicator?
Traders often use several technical indicators to calculate the price, volume, and trend patterns which help them decide which stocks to trade. Technical indicators are necessary when trading in the markets, as they allow the trader to understand what’s actually happening in the markets.
Positive benefits of using technical indicators:
- Help traders identify bearish and bullish trends by looking at the price trend, volume, and momentum, technical indicators that can reveal potential continuation or reversal moves in stocks.
- Indicators help traders find entry and exit points within a stock.
- Indicators can alert traders on different trends and patterns that traders need to know. For instance, some indicators can notify you directly when a stock breaks a key level. Alerts can be helpful if you’re looking to get into or out of a trade at a specific level.
Indicators are a great tool that swing traders can utilize, but they should be careful about which indicator they choose. A common problem with traders is adding too many indicators on their chart and getting “analysis paralysis.” It’s essential to find an indicator that makes chart reading easier for you to work with, then add to it as you define your trading plan.
What are the Best Indicators for Swing Trading?
Swing traders work diligently to use an indicator specifically designed for the specifics of their trading strategy and the current market environment. Fortunately for swing traders, several free and premium indicators are available on trading platforms. Below are some of the best indicators for swing trading that professional swing traders use with their technical analysis.
Best Free Indicators for Swing Trading
Free technical indicators are generally available on just about all trading platforms. For instance, trading platforms like thinkorswim©, tastytrade, TradeStation, and research platforms such as Finviz and TradingView, offer finance news sources and charting capabilities. Learning to operate a free indicator is a significant first step to delving into swing trading. Once traders master an indicator, they can look into more complex indicators to delve into other trading strategies and setups.
Moving Average Indicator (MA)
The moving average indicator is considered by many to be the best free indicator on the market. It calculates the stock price and the mean number of days you want to chart. For instance, swing traders can average the days ranging from five to 200-days. The indicator then charts the exact mean of the stock price in that period. Moving averages are versatile and can be paired with other strategies directly connected with the indicator.
Most traders add more than one moving average to their chart to determine if recent price action is more or less bullish than longer-term price action. If a shorter time period moving average is above a more extended time period moving average, then-recent price action is more bullish for the stock. Below you will find an example of a moving average.
The yellow trend line on the chart is the Moving Average.

Simple Moving Average (SMA)
The simple moving average is one indicator variation that informs the trader of the trend direction of a particular stock. It can tell the trader if the stock is bearish or bullish on the chart. Understanding the market’s direction gives swing traders an advantage in placing their trades.
Exponential Moving Average (EMA)
The exponential moving average is another variation of the moving average indicator that swing traders can consider when trading. The indicator emphasizes the most recent price points more heavily than past price levels. The exponential moving average can pinpoint a more accurate way for swing traders to enter and exit trades by revealing support levels.
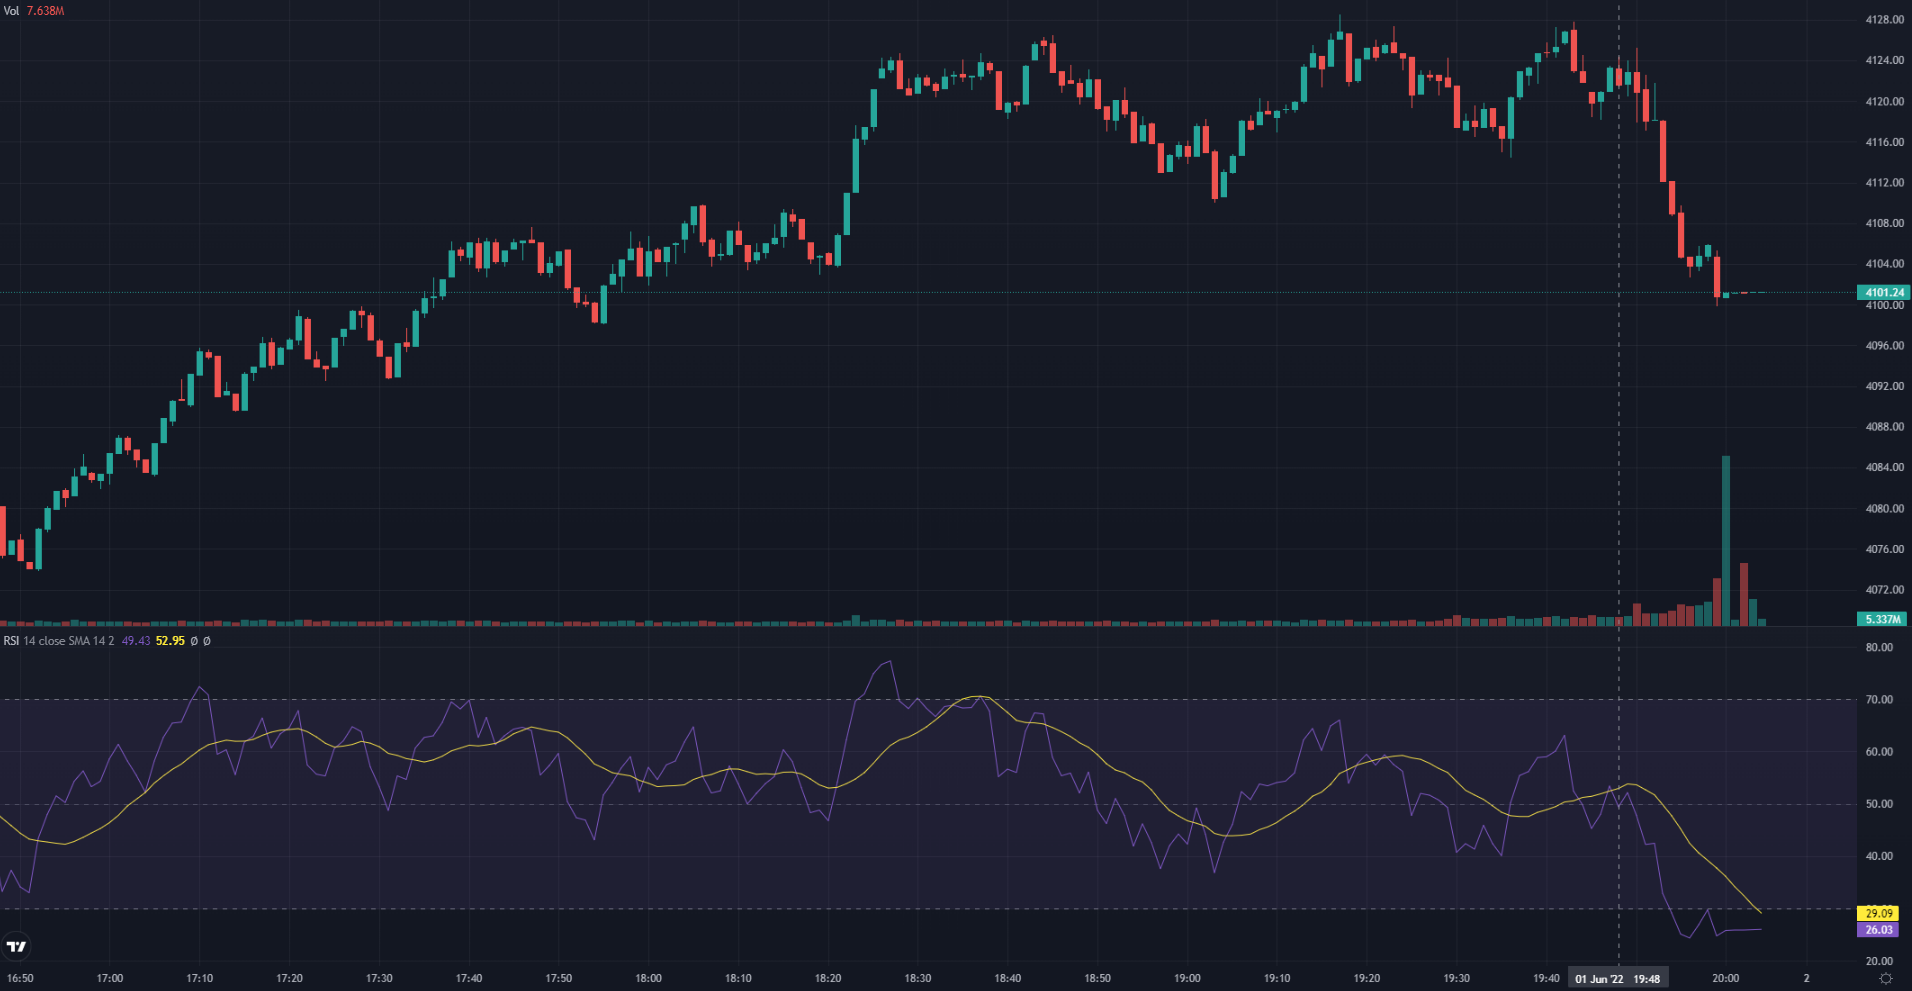
Relative Strength Index (RSI)
The relative strength index is a great indicator for swing traders. It can also be used as a primary or supplementary indicator paired with other indicators that strengthen its usefulness. The RSI indicator is a line graph that moves between 0-100 ranges. The range shows the trader if a stock is oversold or overbought, two levels swing traders can use to determine if a stock is in oversold or overbought territory.
- Oversold: RSI is at 30 or below
- Overbought: RSI is at 70 or above
When a stock is oversold or overbought, it has a higher chance of reversing as buyers step in when it is oversold, and sellers step in when it is overbought.
Volume
Volume is another indicator that can be used to determine the strength of a stock. However, the volume indicator is best used as a supplementary indicator. Swing traders tend to use volume to decide if a stock is worth sticking around a few days or weeks.
For instance, if the stock trend has turned bearish but the stock has a high buy volume, it may indicate a buying opportunity for a swing trader. The trader can assess the market, ride out the bear trend, and profit when the volume has pushed the stock price higher. The same concept applies when a higher stock price does not have the volume to back up its price increase. Swing traders can find low volume as a selling point using the indicator.
Best Premium Indicators for Swing Trading
Premium indicators are indicators that traders generally pay for with their own money. Premium indicators are complex in design but simplify the most up-to-date information given to traders on their technical charting.
The Squeeze Pro
The Squeeze pro is one of the best indicators on the market. It shows when a stock consolidates and builds up energy for its next big move. Traders can use the Squeeze for any time frame combined with moving averages and the built-in histogram to identify which direction the stock will likely take off. There is also a free version of the Squeeze, called the TTM_Squeeze, which you can access on thinkorswim© and tastytrade.
The Compound Breakout Tool
Another excellent swing trading indicator is the Compound Breakout Tool. It pairs well with the Squeeze Pro. The indicator is effective and precise; it has an immaculate layout where traders can have a clean interface that has a lot of information to give to its traders. The indicator is designed to reveal strong setups in up or down markets and can help swing traders find the best trade on the market.
The Moxie Indicator™
The Moxie Indicator is a proprietary tool created by TG Watkins. The indicator can be used to pinpoint breakout positions in the market. The Moxie Indicator is a versatile tool that can be used in an upward or downward trend; it has a unique but effective way to tell traders when to get in stock and when to get out. The indicator works on any time frame, so consider looking at a daily chart if you’re swing trading.
Swing traders are not obligated to stay in front of a computer and monitor the market every hour. Swing traders can conduct their research, find their ideal setup, calmly make a trade, and set exit and stop-loss targets. Aside from the convenience of swing trading, there are many tools and resources that were made for swing traders that let them take advantage of and benefit from current market environments.
If you are interested in swing trading but don’t know where to begin, consider joining us in the Simpler Free Trading Room, where traders can trade with a professional for FREE. Sign up today and gain access to our live trading room, room archives, and free classes. Why trade alone when you can trade with us!

FAQs on Swing Trading Indicators
A: At Simpler Trading, we use indicators from 4 categories: volume, volatility, momentum, and trend.
A: Swing trading requires a combination of technical analysis and market fundamentals. Indicators such as the Relative Strength Index (RSI) and the Moving Average (MA) are great for identifying trends.
A: There is no one best time frame, but generally, the time frames for swing trading are longer than the ones for day trading. Swing traders typically look at hourly charts and above, including daily and weekly charts.
A: There are three types: low-compression squeezes, mid-compression squeezes, and high-compression squeezes.
A: Squeeze Pro is more fine-tuned and designed to find more setups than the original Squeeze. Squeeze Pro offers more edge in the form of different levels of compression, catching more moves.
