About – Squeeze Pro

What is the squeeze pro and how do we use it?
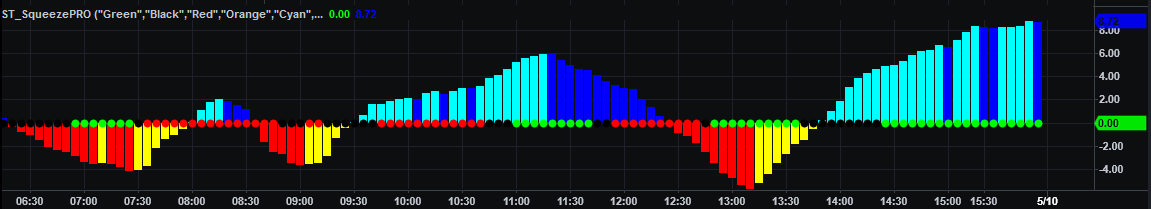
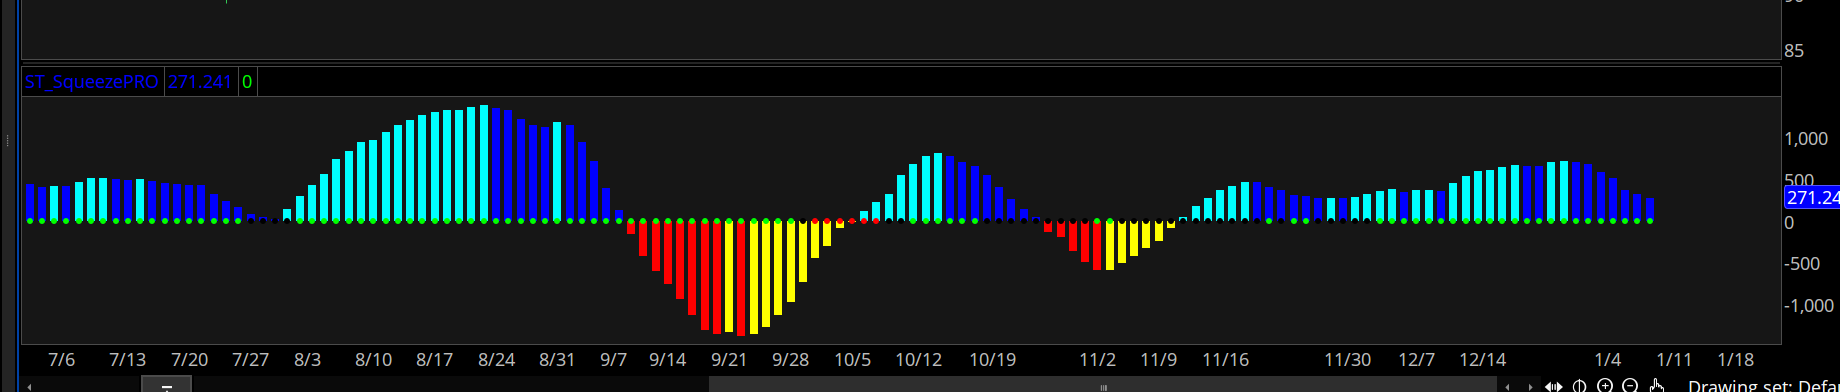
The squeeze is a multi component indicator. The squeeze itself are the dots on the zero line and is a directionless indicator. The Squeeze is an indication that a potentially explosive move in price is coming. The higher the compression, the more potential energy is building. The Squeeze Pro indicator is popular among traders to catch big moves in stocks.
Three types of squeezes are represented in the Squeeze Pro, low, mid and high compression squeezes. More compression, more potential for explosive moves. Conversely, less compression more potential squeezes.
A momentum oscillator shows long or short bias and potential for directional movement in price. If the angle of the momentum is returning to the zero line then there may be a pause or reversal in direction of price.
The Squeeze indicator was initially built from multiple components including Bollinger Bands, Keltner Channels and momentum. The Squeeze Pro will allow you to capture additional moves that the original squeeze would not capture and it is also solid for intra-day trades.
How we use it?
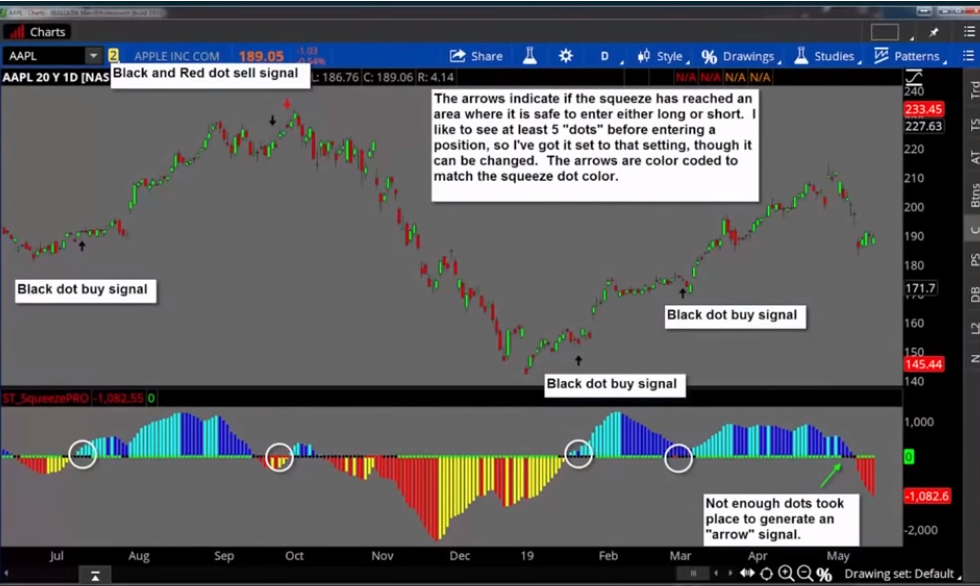
By adding the Squeeze, we can see at a glance when the Bollinger Bands are narrow enough also when to go long or short also when to get out.
The Squeeze: Red dot= “safety zone entry signal” If momentum histogram is above zero after 5 dots, it’s a buy. If it’s below zero, it’s short. Reversal of momentum= “time to get out and wait for the next high probability sign”
With the ability to see all three settings you can easily catch moves that wouldn’t have shown up as a signal with just the old squeeze, you will get an early warning that the standard squeeze may also be about to appear. You also get heads up when volatility gets “extra compressed”.
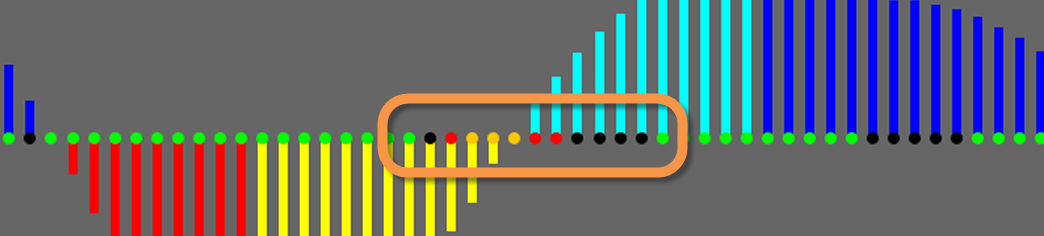
The progression of the squeezes:
The progression of the low (black), red (mid), and high (orange) compression squeezes are shown below.
As the ticker enters the squeeze the black dot represents the low compression squeeze. As Bollinger bands continue to constrict within the Keltner channels, the mid (red dot) compression squeeze displays. As the price action and momentum continues to compress an orange dot shows.
As price action leaves the squeeze, the reverse process is true. The low compression squeeze fires as we enter a mid compression squeeze, the mid compression fires as we enter the low compression squeeze.
Any compression squeeze is considered fired at the first green dot that appears.
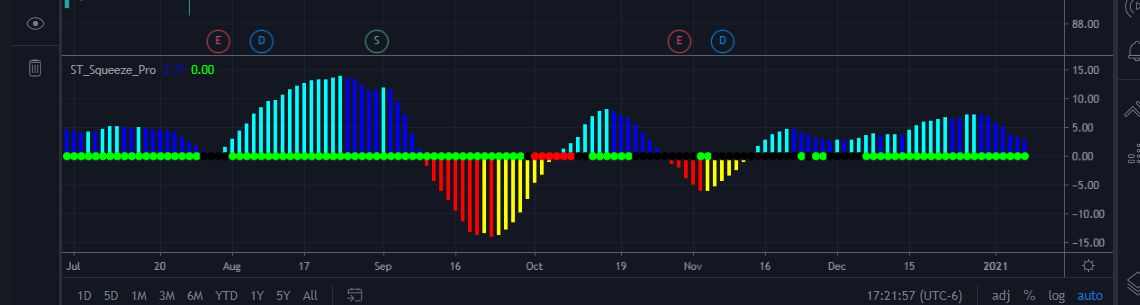
The below is a more ideal illustration of the progression of the different types of squeezes, however any type of squeeze may appear at anytime.
No squeeze (green) > low compression (black) > mid compression (red) > high compression (orange), then exiting the squeeze the reverse is true. See image below.
The Squeeze Pro can be purchased here and is available for TOS, Tasty Works, Trading View, Tradestation.
Squeeze Pro on Trading View
Squeeze Pro on TOS
Squeeze Pro on Tradestation