How to use the TTM Squeeze
Have you ever wondered how traders get into a stock right before it makes a huge move? Most people who are not traders attribute it to luck, but there’s much more to that than just being lucky. In reality, it’s all about the indicator. Indicators are essential technical analysis tools that traders use in the market.
If you are a trader looking for a free indicator, you won’t find anything better than the TTM_Squeeze indicator. The TTM_Squeeze can find some of the most explosive moves in the market. The traders who brag about finding those crazy explosive moves most likely use the TTM_Squeeze. So, let’s get into what the TTM_Squeeze is and how a trader like yourself can use it and change the way you trade.
What is a Squeeze?
There are two types of squeezes: a short squeeze and a squeeze in and a stock price is consolidating before making its next move, which can be seen on the TTM_Squeeze indicator.
A short squeeze is when a stock is under market pressure caused by traders shorting their positions in that stock. While the stock is underpricing pressure from short positions, a news event or rumor can cause prices to rise rapidly, squeezing shorts out of their positions.
A squeeze in the TTM_Squeeze indicator reveals when a stock consolidates or rests before it makes its next big move. The TTM_Squeeze was created to find unique moments in time where a stock is building up energy to make an explosive move.
Are You Ready to Start Trading?
Simpler Trading is known for having the best live-action trading during market hours. Now we have opened the Free Trading Room, where traders who are not accustomed to our world-class service can join a live session for free. So what are you waiting for? Sign up and see the professionals in action and never trade alone again.
What is the TTM_Squeeze?
The TTM_Squeeze is an indicator created by John Carter himself, the founder of Simpler Trading. He created the indicator using the three critical components listed below, which have helped him identify some of his most successful trades. Think of a squeeze like a rubber band; a rubber band is elastic and is made to stretch past the original diameter of its function. Pull the rubber band too far, and it snaps. It’s normal for stocks to move up, down, and sideways. But if it’s stretched sideways without any energy being released, it will snap. The same thing happens to stocks in a squeeze.
There are two free indicators that are incorporated into the TTM_Squeeze signal: Keltner Channels and Bollinger Bands.
Keltner Channel
The Keltner Channel is a volatility component of the TTM_Squeeze, which can help traders identify trends within their position. All Keltner channels have three trend lines to assist the trader. The middle line is the Exponential Moving Average (EMA) associated with the stock price. The top and bottom trend lines are the Average True Range (ATR). When using the Keltner Channels on their own, John Carter prefers to set the ATR to +2 and -2, with the middle line set to 21-period EMA. He also likes to add three sets of Keltner Channels, at 1, 2, and 3 ATR in order to time exits and entries.
Bollinger Bands
Bollinger bands show the standard deviation move of stock, to the upside and downside. When Bollinger Bands narrow and go inside the Keltner Channel, the TTM_Squeeze indicator will show red dots, meaning the stock is in a squeeze. When the Bollinger Bands go outside the Keltner Channel, the TTM_Squeeze dots will turn green which signifies the squeeze has fired.
Video Guide to the TTM_Squeeze
How to Read the TTM_Squeeze?
The benefit of using the TTM_Squeeze indicator is catching a stock before drastically shifting up or down. Traders who have done everything right can reap the rewards of a massive gain. A bonus is that a trader who traded a successful squeeze will benefit from the hype of other traders getting in and trying to get a piece of the action. But, when that happens, that’s usually the sign to get out and let the others sort out the wins and losses. Below is a real example of using the TTM_Squeeze Indicator.
- Red Dots: Squeeze forming; energy is building up
- Green Dots: Squeeze firing, energy is being released in the form of price action, typically lasting 8 to 10 price bars. (Daily chart, 8 to 10 days, hourly chart, 8 to 10 hours, etc)
- Red Histogram: Momentum is on the sell-side
- Yellow Histogram: Momentum is on the sell side, but buying is coming in
- Light Blue Histogram: Momentum is on the buy-side Dark Blue
- Histogram: Momentum is on the buy side, but buying is slowing, and some selling is coming in
TTM_Squeeze Histogram
The histogram helps determine the stock’s direction and if it will explode up or down. Note that no indicator is 100% accurate. The TTM_Squeeze is there to inform the trader of the likely possibility of a move up or down. It’s possible that the indicator can tell you the stock will go up, and when you take a position in that stock, it is possible that it can go down. Therefore, John Carter uses this in combination with exponential moving averages. If the shorter period EMAs are above, the longer period EMAs and the TTM_Squeeze momentum oscillator is positive; John will open a long (bullish) position.

Google (GOOGL) Example
Using GOOGL as an example, you will want to find a stock that enters a tight consolidation on a given timeframe in the chart below, shown by red dots on the TTM_Squeeze. The chart below is a daily chart of GOOGL.
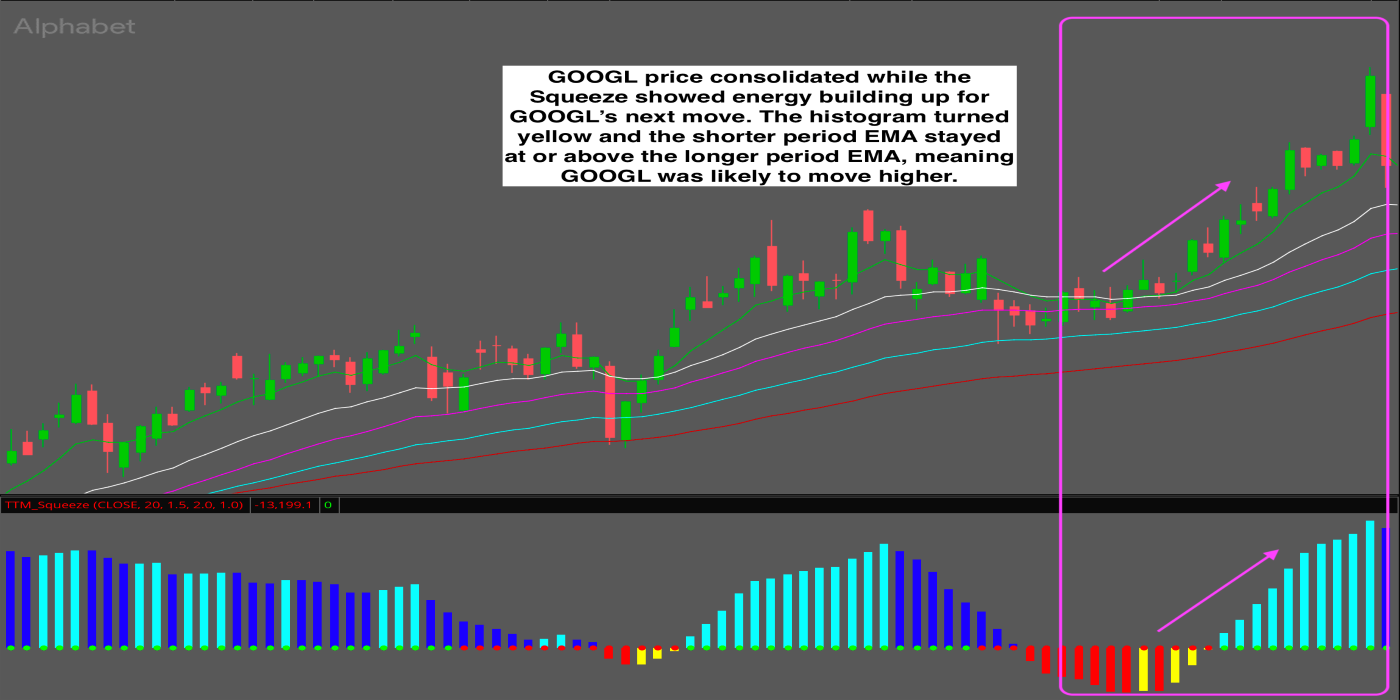
When traders see consecutive red dots on the TTM_Squeeze, the indicator tells you that the stock is in a squeeze. To understand if the stock will go up or down, you will want to see the histogram. The histogram colors are the red, yellow, light blue, and dark blue bars around the TTM_Squeeze. You can see that it is above zero and increasing, which signals that the stock has a high probability of going higher when the squeeze fires. If the histogram is heading lower and is red, the stock has a higher likelihood of going down when the squeeze fires.
Be mindful of your position size and risk threshold; when stocks make a big breakout move, depending on the reasons, other traders may close their position, or there may be a sell-off in the options market. So when you are up big, take profits; other traders will start mitigating their losses quickly.
How to ADD the TTM Squeeze in thinkorswim
The TTM_Squeeze is one of the best free indicators on the market. But in order to use it, you will need to know how to set it up in thinkorswim. Below is a step by step guide to follow, and below that is a visual to ensure you are doing it correctly.
To add the TTM_Squeeze to your thinkorswim charts:
- login to your thinkorswim account
- select the studies button
- add study
- then find John F. Carter studies
- Select the TTM_Squeeze

What is the Squeeze Pro Indicator?
The Squeeze Pro Indicator is an enhanced version of the TTM_Squeeze. At the same time, the TTM_Squeeze is a great indicator that can do wonders for any trader at any experience level. There’s also a premium version of the Squeeze Pro Indicator which quickly and easily identifies three squeeze strength levels, gives traders precise entry and exit points, and catches rallies for traders to profit. If you have outgrown the TTM_Squeeze, try out the pro version.
Do You Want to go Pro?
If you have outgrown the TTM_Squeeze or are looking for a more improved indicator, switch to The Squeeze Pro and get a better read in your charts. The Squeeze Pro will allow you to find better squeezes faster and more accurately. So, If you are ready, make the switch today.
However, the TTM_Squeeze is an excellent indicator; it can help any trader find the best stocks aiming to have a significant breakthrough. It’s easy to read, easy to follow, and easy to learn. All the trader has to do is find a stock in a squeeze and follow the momentum oscillator on the possible direction the stock will take.
Join Us in the Free Trading Room
Simpler Trading now offers the Free Trading Room, where traders who aren’t members can watch and learn how trading is done by dedicated professionals. If you have always been curious about what it’s like to be in a trading environment, now is your chance. Join us today, and see what it’s like.

FAQs on the TTM_Squeeze
A: Squeeze Pro is more fine-tuned and designed to find more setups than the original TTM_Squeeze. Squeeze Pro offers more edge in the form of different levels of compression, catching more moves.
A: There are three such types: low compression squeezes, mid compression squeezes and high compression squeezes.
A: The thinkorswim platform has it available as a free indicator for traders.
A: Red dots mean that there is a squeeze and green dots indicates that there isn’t a squeeze
A: Key components of building a trading discipline: have a trading plan, know how often you want to trade and what asset classes, choose a strategy, and stick to it.
