
The Ultimate Guide to Technical Analysis
Technical analysis is a key tool that all traders should use to help them make better-informed trading decisions. By understanding and using technical analysis, traders can improve their chances of being profitable and reduce the chances of blowing out their accounts.
In this blog post, we’ll explore the basics of technical analysis and its importance for traders. So, whether you’re new to trading or have been doing it for some time, be sure to read on!
What is technical analysis?
Technical analysis evaluates securities, like stocks and futures, by analyzing market activity, such as past prices and volume. Traders use this data to identify patterns and trends that can suggest buying or selling opportunities.
Technical analysis is based on the idea that past market trends can help identify future trends, as shown by charts and other technical indicators. Using technical analysis doesn’t guarantee profitability as many internet ‘Gurus’ imply, but it can significantly increase a trader’s ability to identify high-probability trends as they form, giving them a huge competitive advantage.
Difference between fundamental and technical analysis
Fundamental analysis is a method of evaluating a security’s intrinsic value by analyzing its financial and economic fundamentals. This includes analyzing a company’s financial statements, such as its balance sheet, income statement, and cash flow statement. Fundamental analysis may also include analyzing relevant economic data pertaining to the underlying asset, such as industry or sector trends. These data sets are often used to make long-term price predictions.
Compared to fundamental analysis, technical analysis focuses on identifying trading signals generated by looking at past market trends and price relationships. Technical analysis usually consists of using one or more indicators or studies applied to a chart. These technical indicators are often used to identify and ‘predict’ short-term price movements in the underlying asset.
Each method of analysis has a real benefit when used in conjunction with the appropriate strategy, mainly investing vs. trading. One main distinction between these two strategies can be broken down into timeframes.
Fundamental analysis is typically associated with buying and holding over longer timeframes, while technical analysis is typically associated with buying and selling in much shorter timeframes. Investors are often concerned about the long-term trends of the underlying asset, while traders are often focused on short-term price action.
Types of technical indicators
Technical indicators can be incredibly useful for traders, helping to inform decision-making about when to enter and exit trades. A few of the most commonly used indicators are moving averages, trend lines, support and resistance levels, Bollinger bands, Fibonacci levels, and many more. For the purpose of this blog, we will review technical indicators that are widely used and free on most charting platforms.
Moving averages
Moving averages are a type of trend indicator that shows the average price of a security over a set period of time. They are commonly used in technical analysis to smooth out price data and identify trends. There are several types of moving averages, including simple moving averages (SMAs), exponential moving averages (EMAs), and weighted moving averages (WMAs).
Some of the most common moving averages our traders use is the 5, 8, 21, 34, 50, 100, and 200-period moving averages.
How are moving averages calculated?
To calculate a moving average, you must first select a time period. This could be a number of days, weeks, or months. Then, you add up the prices of the security over the selected time period and divide the total by the number of periods. For example, if you are calculating a 20-day moving average, you would add up the prices of the security for the past 20 days and divide the total by 20.
What are the main benefits of using moving averages?
One of the main benefits of using moving averages is that they can help identify trends in the market. When the price of a security is above its moving average, it is generally considered to be in an uptrend. Conversely, when the price is below the moving average, it is typically considered a downtrend. Moving averages are particularly useful when used in relation to one another.

There are a few key things to consider when using moving averages for technical analysis:
- Length of the moving average: The length of the moving average can affect the sensitivity of the indicator. Shorter moving averages will react more quickly to price changes, while longer moving averages will be slower to react. This means that a 5-period moving average will follow price action more closely than a 200-period moving average.
- Crossover signals: When a shorter-term moving average crosses above a longer-term moving average, it is generally considered a bullish signal. Conversely, when a shorter-term moving average crosses below a longer-term moving average, it is typically seen as a bearish signal. For example: If a 5-day moving average crosses above the 8-day moving average, it may indicate a bullish trend.
- Support and resistance: Moving averages can act as support and resistance levels. When the price of a security bounces off its moving average, it may be considered a sign of support. If the price breaks through the moving average, it may be seen as a sign of resistance.
- Multiple moving averages: Using multiple moving averages to confirm trends or identify potential reversal points can be very effective. For example, if a 21-day, 50-day, and 100-day moving averages are all trending upwards, it may be a stronger bullish signal than if just one of the moving averages is trending upwards. We refer to this as “stacked positive” and can be a green light when looking to initiate a bullish trade if all other trade criteria are met. If all moving averages are moving lower, it may serve as a green light to initiate a bearish trade if all other trade criteria are met.
It’s important to note that moving averages are just one tool in a technical analyst’s toolkit and are often more effective when used with other indicators.
Trend Lines
Trend lines are a popular tool in technical analysis used to identify trends in the market and forecast future price movements. They are drawn by connecting a series of price points on a chart and are typically used in conjunction with other technical indicators.

What are trend lines used for
Trend lines are often used by traders as a part of their technical analysis for some of the following reasons:
- Identifying trends: Trend lines can help traders identify the direction of a trend and determine whether a security is in an uptrend, downtrend, or trading range. When the price of a security is consistently trending upwards and making higher highs and higher lows, it is generally considered to be in an uptrend. Conversely, it is typically considered a downtrend when the price is consistently trending downwards and making lower highs and lower lows.
- Forecasting future price movements: Trend lines can also be used to forecast potential price movements. When the price of a security is approaching a trend line, traders may consider it a key level to watch. If the price breaks through the trend line, it may be a sign of a potential trend reversal.
- Providing support and resistance: Trend lines can also act as support and resistance levels. When the price of a security bounces off a trend line, it may be considered a sign of support. If the price breaks through the trend line, it may be seen as a sign of resistance.
There are a few key factors to consider when using trend lines in technical analysis:
- The trend line slope can indicate the trend line’s strength. A steep trend line may indicate a strong trend, while a shallow trend line may indicate a weaker trend.
- The number of touch points: The more touch points a trend line has, the more significant it may be. A trend line with three or more touch points is generally considered to be more reliable than one with only two touch points. Touchpoints can be defined as how often price action “touches” the trend line, indicated by red boxes in the image above.
- Confirmation from other indicators: It’s important to consider trend lines in conjunction with other technical indicators, such as moving averages or oscillators. Confirmation from other indicators can help increase the reliability of a trend line.
Trend lines can be powerful when used with other indicators to help identify future moves in an underlying asset. David Starr and Neal Yeager, well-established expert traders, have co-created the TrendSpark Indicator. This indicator can identify the dominant trendline on any timeframe and pinpoint precise entries and exits as early as possible.
Areas of support and resistance
Support and resistance levels provide clear reference points which show either potential changes in direction or the continuation of existing trends.
Support and resistance levels are key concepts in technical analysis used to identify potential turning points in the market. Support refers to a price level where demand for a security is strong enough to prevent the price from falling further. On the other hand, resistance is a price level where supply is strong enough to prevent the price from rising further.
Areas of support and resistance often comprise many factors that may include multiple technical indicators and key psychological levels. Market psychology plays an important role in relation to areas of support and resistance. Key psychological levels of support and resistance can often be found around round numbers. For example, on SPX, 3900 appears to be a key psychological level, as indicated by the image below.

Support and resistance levels are important for a few reasons:
- Identifying potential reversal points: When the price of a security approaches a support or resistance level, traders may consider it a key level to watch. If the price breaks through the level, it may be a sign of a potential trend reversal.
- Providing guidance for trade entry and exit: Support and resistance levels can also be used to determine potential trade entry and exit points. For example, traders may consider entering a long position when the price of a security bounces off a support level or exiting a long position when the price approaches a resistance level.
- Identifying potential trends: The presence of multiple support and resistance levels can also be used to identify potential trends in the market. If the price of a security is consistently finding support at a particular level and making higher lows, it may be considered to be in an uptrend. Conversely, if the price consistently finds resistance at a particular level and makes lower highs, it may be considered a downtrend.
There are a few key things to consider when using support and resistance levels for technical analysis:
- The number of touch points: The more touch points a support or resistance level has, the more significant it may be. A level with three or more touch points is generally considered more reliable than one with only two touch points. Touchpoints can be used to determine how well price “respects” an area of support or resistance, indicated by the red boxes in the image above.
- The proximity of the level to the current price: A support or resistance level closer to the current price may be considered more significant than one farther away.
- Confirmation from other indicators: It’s important to consider support and resistance levels in conjunction with other technical indicators, such as moving averages or trend lines. Confirmation from other indicators can help increase the reliability of a support or resistance level.
Bollinger Bands
Bollinger bands are a technical indicator that plots upper and lower bands around a moving average to provide a measure of volatility. They are used by traders to identify potential market trends and opportunities, such as breakouts and overbought/oversold conditions. To use Bollinger bands, traders select a moving average and the number of standard deviations for the bands. The upper and lower bands are plotted around the moving average at a distance equal to the standard deviation. The Bollinger band is a study that can be applied to most charting applications such as Thinkorswim or Trading View.

Traders and investors can use Bollinger bands in a variety of ways. Some common uses include
- Identifying potential breakouts: If the price of a security moves outside of the upper or lower Bollinger band, it may indicate a potential trend change. Traders may then look for other confirming signals, such as a change in volume or a breakout on other technical indicators, before making a trade.
- Setting stop-loss orders: By setting a stop-loss order at the upper or lower Bollinger band, traders can protect against potential trend reversals.
- Identifying overbought and oversold conditions: If the price of a security is consistently near the upper Bollinger band, it may indicate that the security is overbought and could be due for a price correction. Similarly, suppose the price is consistently near the lower Bollinger band. In that case, it may indicate that the security is oversold and could be due for a price increase.
- Contraction and expansion: Bollinger bands expand with volatility and contract in periods of consolidation. At a quick glance, Bollinger bands can tell you how the underlying asset is trading in relation to its standard deviation, denoted by the expansion or contraction of the bands in relation to its moving average.
John Carter, a well-known options trader, understood the value of using Bollinger bands early in his career. He later developed the famous indicator called The Squeeze™, which uses the Bollinger bands in conjunction with Keltner channels and the momentum oscillator to identify when stocks are setting up for larger-than-expected moves. The Squeeze™ is one of the most commonly used indicators on the Thinkorswim platform.
Fibonacci Levels
Fibonacci levels are horizontal lines on a chart used in technical analysis to identify potential support and resistance levels. They are based on the Fibonacci sequence, a series of numbers where each number is the sum of the previous two numbers (e.g., 0, 1, 1, 2, 3, 5, 8, 13, 21, 34, etc.). The Fibonacci sequence is a mathematical ratio ubiquitous in the physical world; however, in trading, these ratios are often used to predict the percentage of an extension or retracement.
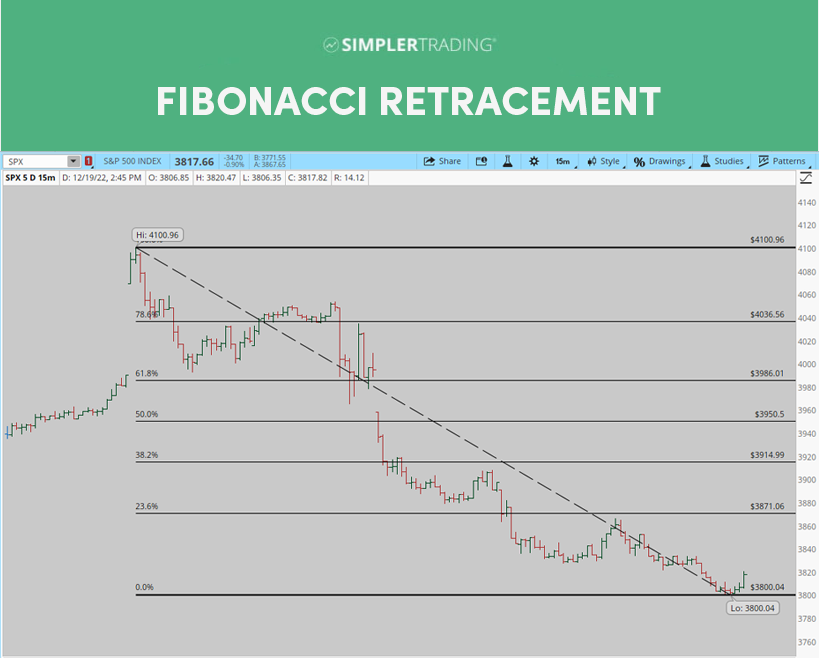
Common levels within Fibonacci retracements:
- The 0.236 level, or 23.6%
- The 0.382 level, or 38.2%
- The 0.500 level, or 50%
- The 0.618 level, or 61.8%
- The 0.764 level, or 76.4%
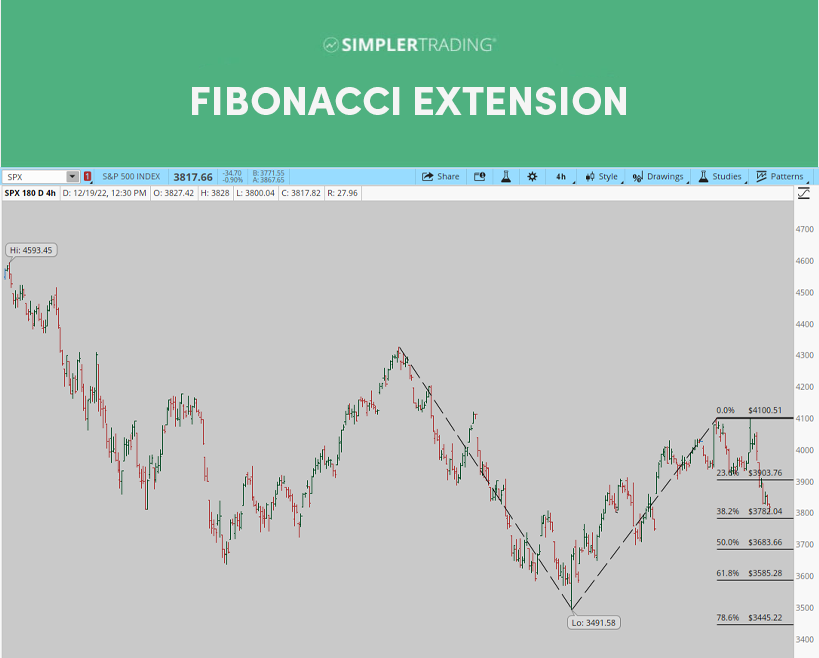
Common levels within Fibonacci Extensions:
- The 0.618 level, or 61.8%
- The 1.00 level, or 100%
- The 1.618 level, or 161.8%
- The 2.0 level, or 200%
- The 2.618 level, or 261.8%
Fibonacci levels are essential for a few reasons:
- Identification of potential support and resistance levels: When the price of a security approaches a Fibonacci level, traders may consider it a key level to watch. If the price bounces off the level, it may be a sign of support. If the price breaks through the level, it may be a sign of resistance.
- Confirmation of trends: Fibonacci levels can also be used to confirm trends in the market. If the price of a security is consistently finding support or resistance at a particular Fibonacci level, it may be considered a trend.
- Forecasting potential price targets: Fibonacci levels can also be used to forecast potential price targets. For example, if the price of a security breaks through a resistance level at the 0.618 Fibonacci level, traders may consider the 0.764 level as a potential price target. Traders often use Fibonacci retracements or extensions to identify potential price movements in the underlying asset.
There are a few key things to consider when using Fibonacci levels for technical analysis:
- The proximity of the level to the current price: A Fibonacci level closer to the current price may be considered more significant than one that is farther away.
- Confirmation from other indicators: It’s important to consider Fibonacci levels in conjunction with other technical indicators, such as moving averages or Voodoo Lines. Confirmation from other indicators can help increase the validity or reliability of a Fibonacci level.
- The time frame of the chart: The time frame of the chart can also affect the significance of Fibonacci levels. For example, a Fibonacci level on a daily chart may be more significant than one on a 5-minute chart.
Fibonacci ratios are just one tool in a technical analyst’s toolkit and are often more valid when found near areas of support and resistance indicated by moving averages, trendlines, etc.
How to use technical analysis with your trading plan
Creating a trading strategy using technical analysis requires careful thought and planning. Begin by developing a trading plan that outlines how you will enter, exit, and manage trading positions based on your risk tolerance. This should include a description of the criteria you will use to enter or exit any trade. If you haven’t started creating your trading plan yet, check out our free template here! Once you develop your trading plan, you can start putting together your trading strategy.
To figure out which trading strategies fit your personality and trading goals, it helps to see examples of trading plans. You will find actual plans for each of our veteran trading mentors in their trader profiles – including John Carter.
Then research, research which indicators can be used with your trading style and strategy. For more information on how to apply indicators or studies to your Thinkorswim charts, check out our learning center.
Successful traders who use technical analysis
John F. Carter and Raghee Horner are two successful traders who both make extensive use of technical analysis. John F. Carter is a bestselling author, trader, software designer, and day trading expert who has developed various technical indicators used to identify trades in any market condition. His leading indicator, The Squeeze™, determines the market’s momentum and direction and is used by thousands of traders around the world.
Similarly, Raghee Horner is a pro trader known for her adept use of combinations of lagging indicators, such as moving averages and oscillators, to generate trading signals for an edge in options and futures markets. Her trend-following strategies based on advanced technical analysis have earned her a spotless reputation over more than two decades of pro trading experience.
In Conclusion
In conclusion, technical analysis is a powerful tool that can help traders make informed decisions about when to buy and sell securities. It allows traders to identify high-probability trade setups, predict future price movements, and make better trading decisions. Learning technical analysis can give traders an edge in the markets and can improve their overall trading performance.
If you want to learn technical analysis from the best traders online, then the simplertrading.com Simpler Central live trading room is the perfect place for you. In this interactive and engaging environment, you can learn from experienced traders who have a track record of success using technical analysis.
Whether you’re an intermediate or an experienced trader, the simplertrading.com Simpler Central live trading room has something for everyone. So don’t wait any longer, join us today and start improving your trading skills with technical analysis!