
Anything can happen when trading in a volatile market, and traders who have never experienced market volatility may learn that lesson the hard way. Traders who do not have an edge in volatile markets or understand how to limit risk accordingly, often get burned. However, some traders use volatility to give them an edge in the market. When traders use the right tools and strategies, volatile conditions can create opportunities.
This article discusses the following:
- What is the Volatility Index
- How to read the VIX Index
- What is the stock volatility symbol?
- Using $ADD & $TICK as market internals
- Keeping emotion out of the trade
- Importance of a trading plan
What Is The Volatility Index?
VIX is the symbol for stock volatility – the Chicago Board Of Exchange (CBOE) Volatility Index (VIX). The CBOEVolatility Index (VIX) is a real-time market index representing expectations for volatility over the coming 30 days. Sometimes referred to as the “fear factor,” traders use the VIX to measure the level of risk, fear, or stress in the market.
VIX price volatility tends to rise when stock prices fall as investors become uncertain about their investments. Conversely, the VIX, or stock volatility, tends to decline when stock prices rise. Generally, this would result from investors feeling particular about market expectations.
Because the VIX is a forward-looking index, it’s constructed using the implied volatilities on S&P 500 index options – as they represent the expectations of the market participants of the 30-day future volatility of the S&P 500 Index. The S&P 500 is considered the leading indicator of the broad U.S. stock market sentiment.
Trading SPX in volatility
When we consider trading a volatile market, we should remember that even traders who have been in the markets for 30-plus years do so meticulously and carefully. A stand-alone strategy does not exist that traders can apply to their volatility trading setups.
Fortunately, traders have indicators that reveal certain conditions. John Carter’s trade in January 2022 seized an opportunity and walked away with a $1.36 million trade on the S&P 500 INDEX (SPX).
Let’s explore John’s this trade to see what we can learn from volatility in the stock market.
On Monday, January 24, the markets were experiencing wild volatility. The S&P 500 index plunged over 170 points in the morning, then rallied to finish higher on the day. With such substantial price swings, the market began to reveal opportunities.
Due to extreme volatility, John approached the setup with the mindset of a day trader. John watched both the one-hour and 30-minute charts. Once he saw the trend reversal, he confirmed the signal with market internals, where he found clear signs that the sell-off was exhausted and the SPX was poised to rip higher.
John noticed buyers were flooding the SPX and overwhelming the sellers. Because of the volatile markets, John exited this position shortly after and returned to cash. As he says, “In volatile trading, a bird in the hand is worth six in the bush!” The $1.36 million was money in his hand, which is where it stayed.
Reading the VIX Chart
Sometimes compared to an electrocardiogram, the VIX index chart ($VIX) gets to the heart of the matter. Market sentiment reveals what traders are thinking. Quite simply, when the VIX is trending higher, it indicates fear increasing.
The VIX chart generates vertical spikes that reflect periods of high stress induced by economic, political, or environmental catalysts. Traders watch absolute levels when interpreting chart patterns. Often, they look for reversals around big round numbers, like 20, 30, or 40, and near prior peaks.
Traders also pay attention to interactions between the VIX level and the 50 and 200-day exponential moving averages (EMAs). These levels may indicate potential areas of support at the lows and areas of resistance at the highs.
The VIX Index typically reverts to the mean as a volatility indicator. Although equity indices can rise indefinitely, the VIX Index, over time, will generally return or move back to its historical average. Traders should reevaluate positioning when the moving average changes direction as this foretells reversals and completion of price swings in both directions.

VIX as an indicator
Traders who have an understanding of the VIX can put this to use as it tends to favor long and short puts. The VIX can be used as a market indicator that measures institutional sentiment. The VIX helps traders look for tops and bottoms in the trend and lets them get an idea of the mood of the prominent market players.
This is helpful when preparing for trend changes and when investors are determining which option hedging strategy is best for their portfolio. Traders like to measure the significant market players and institutions in the equity markets. Finding out where the money flows in the markets provides a serious advantage, and the VIX can help traders determine what’s happening.
Large market movers are like ocean liners. They can’t make sudden turns unnoticed. However, retail traders can. If institutions perceive the market is turning bearish, they aren’t able to simply unload stock. They buy put option contracts or sell call option contracts to offset some of the losses. The VIX can be both a measure of supply and demand for options and a put/call ratio.
Trading the VIX
Since traders cannot trade the VIX itself, they must trade either VIX options or futures. The VIX must be traded on a derivative contract. Since the VIX is the implied volatility of the S&P 500 Index options, these options use such high strike prices and premiums that are so expensive that very few retail investors are willing to use them. Retail options traders generally opt for a less expensive substitute like options on the SPDR S&P 500 ETF Trust (SPY), an exchange-traded fund (ETF) that tracks the S&P 500 Index.
One of the most extensive VIX products is the iPath Series B S&P 500 VIX Short-Term Futures ETN (VXX). Barclays Capital issues the VXX with more than $537 million in assets as of April 2022.
The iPath Series B S&P 500 VIX Mid-Term Futures ETN (VXZ) is similar to the VXX but holds positions in fourth, fifth, sixth, and seventh-month VIX futures. It tends to be a much less volatile play on volatility. Position traders should not use VIX options and futures as long-term, buy-and-hold investments.
Stick To The Trading Plan
However you decide to use volatility in your trading, it can’t be stressed enough; stick to your trading plan, especially when the market is volatile.
Having a trading plan can often be the determining factor in whether someone is successful in their trading career. The entire team at Simpler Trading has a trading plan. This is a precedent that John started early on because: if you fail to plan in the markets, you plan to fail.
Traders should not feel an urgency to trade in a volatile market. Entering a trade at the wrong time only fuels the adage that “the stock market is an equal opportunity dream killer.” Remember to stick to the following tenets:
- Have and use a trading plan.
- Reduce risk exposure through position sizing.
- Have well-defined time frames for your trades.
- Don’t stay in a trade too long.
- Look for the trend reversal.
Traders who brave volatile markets should look for a trend reversal. This strategy is critical in Volatility trading.
Monitor market internal signals
Technical indicators are essential to trading, especially day trading. They can provide critical entry and exit signals and help with quick decision-making – helpful when trading in a volatile market. Which market internals should you follow? These are a few that our traders use:
- Moving Average
- TICKs ($TICK)
- Advanced-Decline Line ($ADD)
- Volume Spread ($VOLSPD)
- Put-Call Ratio ($PCVA)
- VIX Volatility Index (VIX)
- Bonds (TLT)
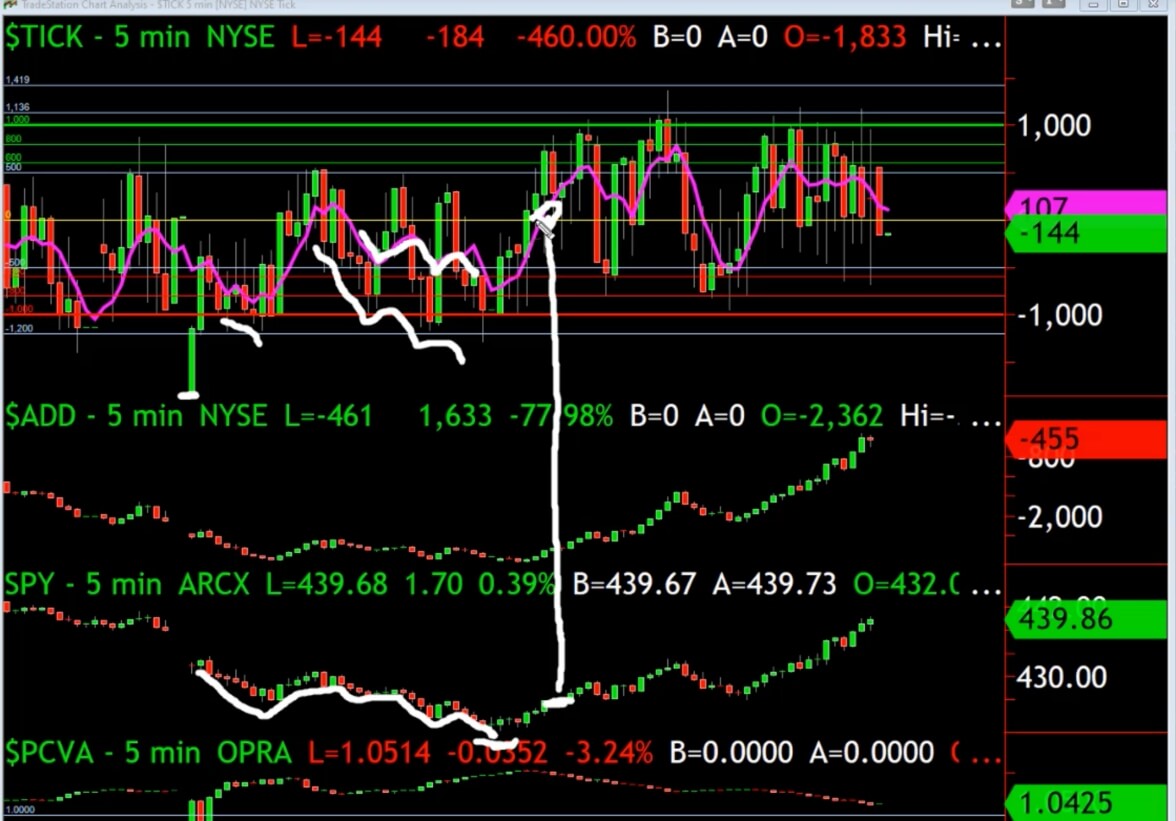
Two market signals are generally helpful when trading volatile markets. Simpler traders watch market internals, specifically $ADD and $TICK. (These symbols are used like stock symbols in online trading software). Monitoring these two internal market signals together allows traders to target a confirmation of a move ($ADD) and gain insight into how fast the move will unfold ($TICK).
$ADD – Advance/Decline Line (ADD) indicates whether stocks are trading above or below their prior close. This internal signal defines a sense of overall movement in the market. When reading the $ADD indicator, above zero (positive) shows that most stocks are up for the day, i.e., a green day. When $ADD is below zero (negative), most stocks move lower for the day, i.e., a red day. Think of $ADD as a steering wheel in a car pointing the wheels of the market in a specific direction.
$TICK – This measures upward or downward movement in the price for a security, i.e., how fast tickers are bought and sold. Keeping with the car metaphor, think of $TICK as the gas pedal affecting how fast the price is moving. Here are some key areas to pay attention to when watching the $TICK:
- Zero shows the market chopping sideways
- Upper zones show from $600 to $1,000
- Lower zones offer from -$600 to -$1,000
In bear market conditions (lower zones), continually negative $TICK indicates more selling than buying. Extreme buying is shown in the upper zones, and price holding here indicates a higher potential for an explosion in the market.
Monitoring these two internal market signals together allows traders to target a confirmation of a move ($ADD) and gain insight into how fast the action will unfold ($TICK). This helps gauge the overall market and gain an edge in trading.
Avoid Trading On Emotion: How?
One of the biggest mistakes by traders when trading in volatile markets is panic buying or selling. To be a successful trader, you must avoid trading with fear, greed, or revenge. Experience is an excellent teacher. Traders eventually learn how to trade in volatile markets because they’ve seen them before, taken a few hits, and learned how to weather the markets.
A trading plan allows traders to set boundaries and helps remove opportunities for emotional trading. If you’re serious about success, you will want to continuously study the art of trading and add more insight to your trading plan. That includes evaluating your trading practices, learning your triggers, and staying disciplined.
At Simpler Trading, we understand one of the best ways to improve trading skills is to trade alongside veteran traders in the live trading rooms. The weekly report, This Week In The Markets, thoroughly evaluates the critical sectors of the market. It provides highlights in concise, easily digestible briefings. It encompasses everything from stocks to commodities, indices, and Bitcoin.
Sam Shames reveals what fundamental ETFs are doing, including the SPY, QQQ, DIA, IWM, and his FANG Index. He also provides a detailed breakdown of market internals, volatility, the yield curve, and other sectors you need to know about to stay on top of volatile markets.
FAQ: on the Volatility Index
Swing traders pivot to day trading techniques amid volatility. Check out this daily training and learning option. Staying agile with quick entries and exits allows traders to manage risks during risky markets.
The Volatility Index (VIX) tends to trend higher in a bear market that hasn’t reached the bottom yet. Panic and fear inspire sell-offs that cause the VIX to head even higher. The VIX could reach up to 100 in uncertain markets. Anything above 35 could lead to panic and one step closer to capitulation among market participants.
Disappointing and unsettling economic data – struggling job numbers, rising consumer and producer prices, weak retail sales, and higher mortgage rates – combined with inflation all contribute to market fear. Volatility in a bear market creates a more intense level of risk, which concerns market participants. When this occurs, there tends to be less liquidity, or cash flow, in the markets. Rising interest rates by the Federal Reserve are not the only catalyst to market volatility. Traders should consider not being in a hurry to challenge volatile market movement.