
How does the Ichimoku Cloud Work?
The reason this is one of my favorite indicators is that it isn’t a lagging indicator, meaning that it gives a forward projection and doesn’t just update with the current price.
In this article, I’m going to introduce and break down the Ichimoku Cloud in detail, so that you can add this indicator to your trading arsenal.
The Ichimoku Cloud simply works in two ways:
- It’s a gauge of trend on multiple time frames
- It gives key levels and inflection points to focus on (including both current and future key levels)
Gauge of Trends
One of the first ways to use the Ichimoku Cloud is to define the trend of the stock you’re looking at. As long as price action trades above the physical “cloud”, we are bullish. If the price ever trades below the “cloud,” we have a bearish sentiment.
This is a great way to identify what the true trend is on the daily or weekly time frame. For day traders, we can also use smaller time frames to gauge the trend at that moment in time. You can see in the screenshot below that as long as the price was above the Ichimoku Cloud, the trend continued to the upside:

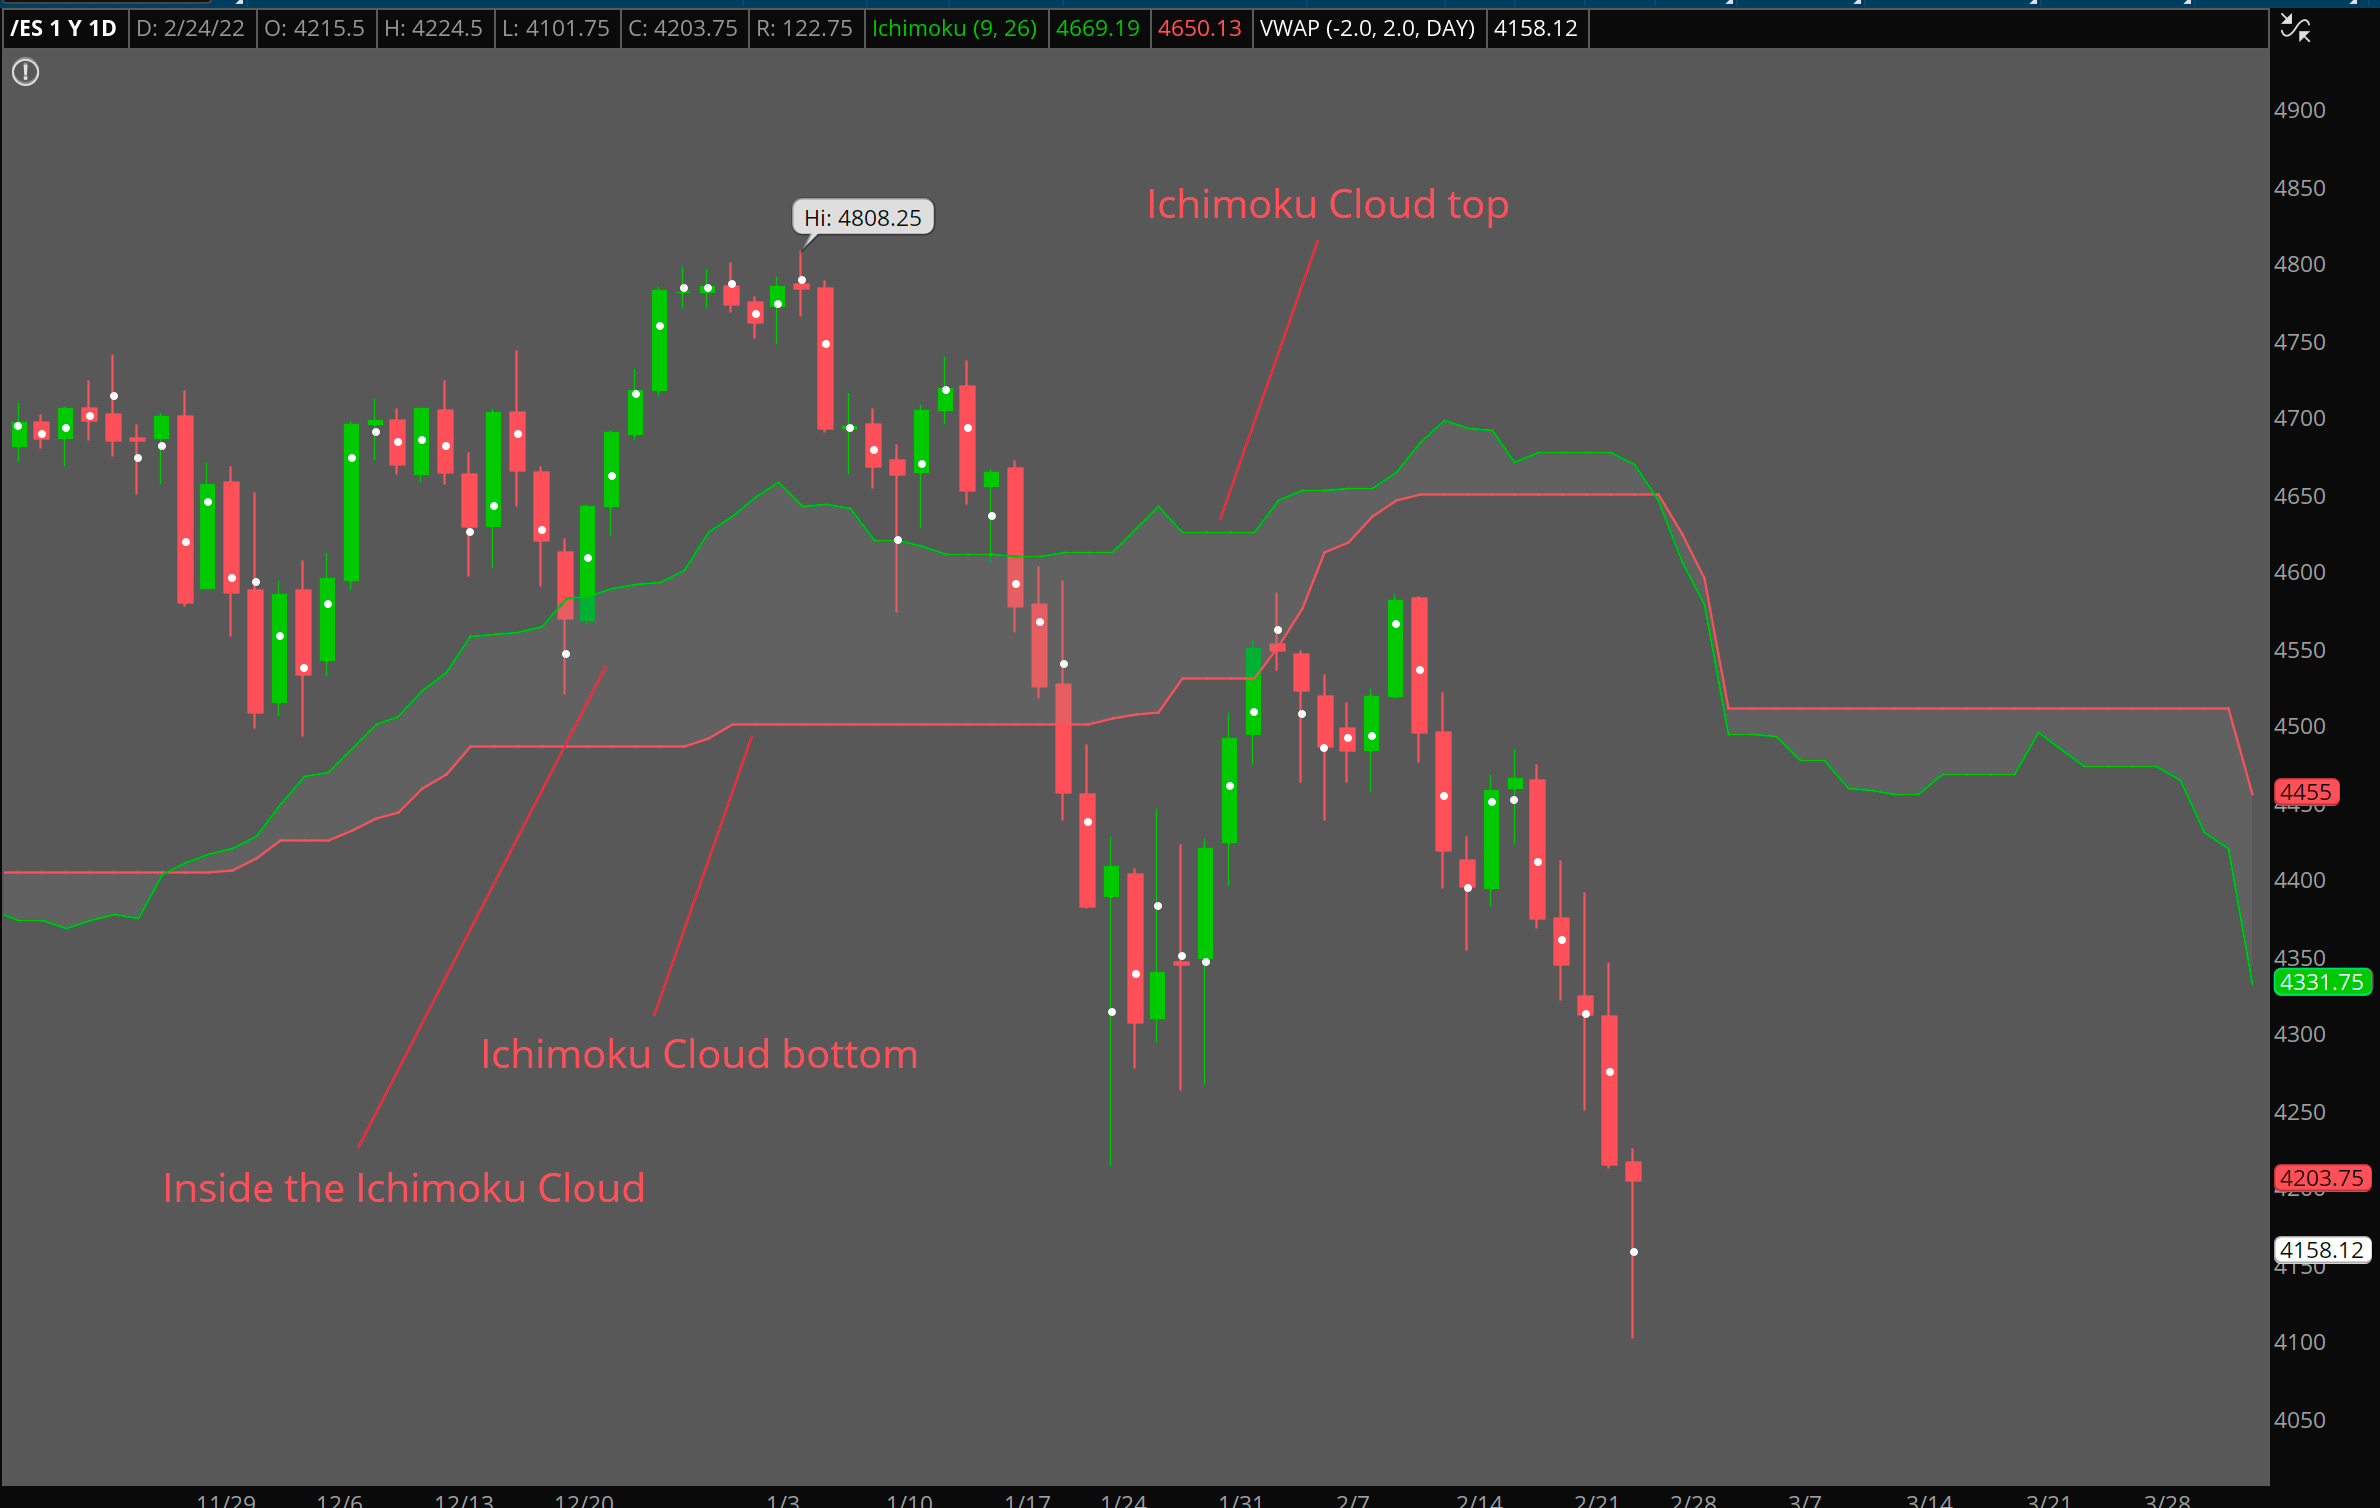
Let’s take a look at a bearish trend when the price falls below the Ichimoku Cloud: You can see in January 2022 price broke below the Ichimoku Cloud, and the trend for the following months was bearish.
This is how you can visualize and understand the type of trend you are looking at for different stocks on multiple time frames.

Key Levels and Inflection Points
The Ichimoku Cloud also gives you the power to see key levels and inflection points that you can focus on currently as well as in the future. When I say future levels, I mean that it shows you where the Ichimoku Cloud will be if the price ever reaches that point. This is automatically a level that you can tie into your game plan when using the Ichimoku Cloud… Let me show you how it works.
Because we are aware of the Ichimoku Cloud levels ahead of time, if the price reaches the Ichimoku Cloud and hits it, this level becomes an amazing dip buy opportunity. You can see how many times price tested the Ichimoku Cloud top, kissed it, and exploded off of it in the screenshot below (marked by light gray circles). This is where we would want to buy the dip – as price hits the Ichimoku Cloud top and starts to explode off of it.

If price breaks inside of the Cloud, we can look for price to dip to the bottom of the Ichimoku Cloud. Because these levels are here in advance, we are able to plan the trade and understand where the price might fall to.
If the price drops and holds the top of the Ichimoku Cloud, that becomes a great dip buy as we discussed above. If the price falls and breaks through the top of the Ichimoku Cloud, this becomes a great short opportunity to the next key level at the bottom of the Cloud.
Video Guide to the Ichimoku Cloud
Should You Start Day Trading?
Before you start to day trade, you need to understand that day trading can be extremely risky. However, it’s one of the most popular forms of trading.
Here at Simpler Trading, we have a solution, we offer guidance and mentorship in our day trading room, and if you become a member today you will gain immediate access to the live trading chatroom, premium weekly videos, and the weekly watchlist curated by one of our traders. So, join today and meet our traders, so you never have to trade alone again.
How to Read the Ichimoku Cloud
Let’s go through an example of ROKU here on a weekly chart:
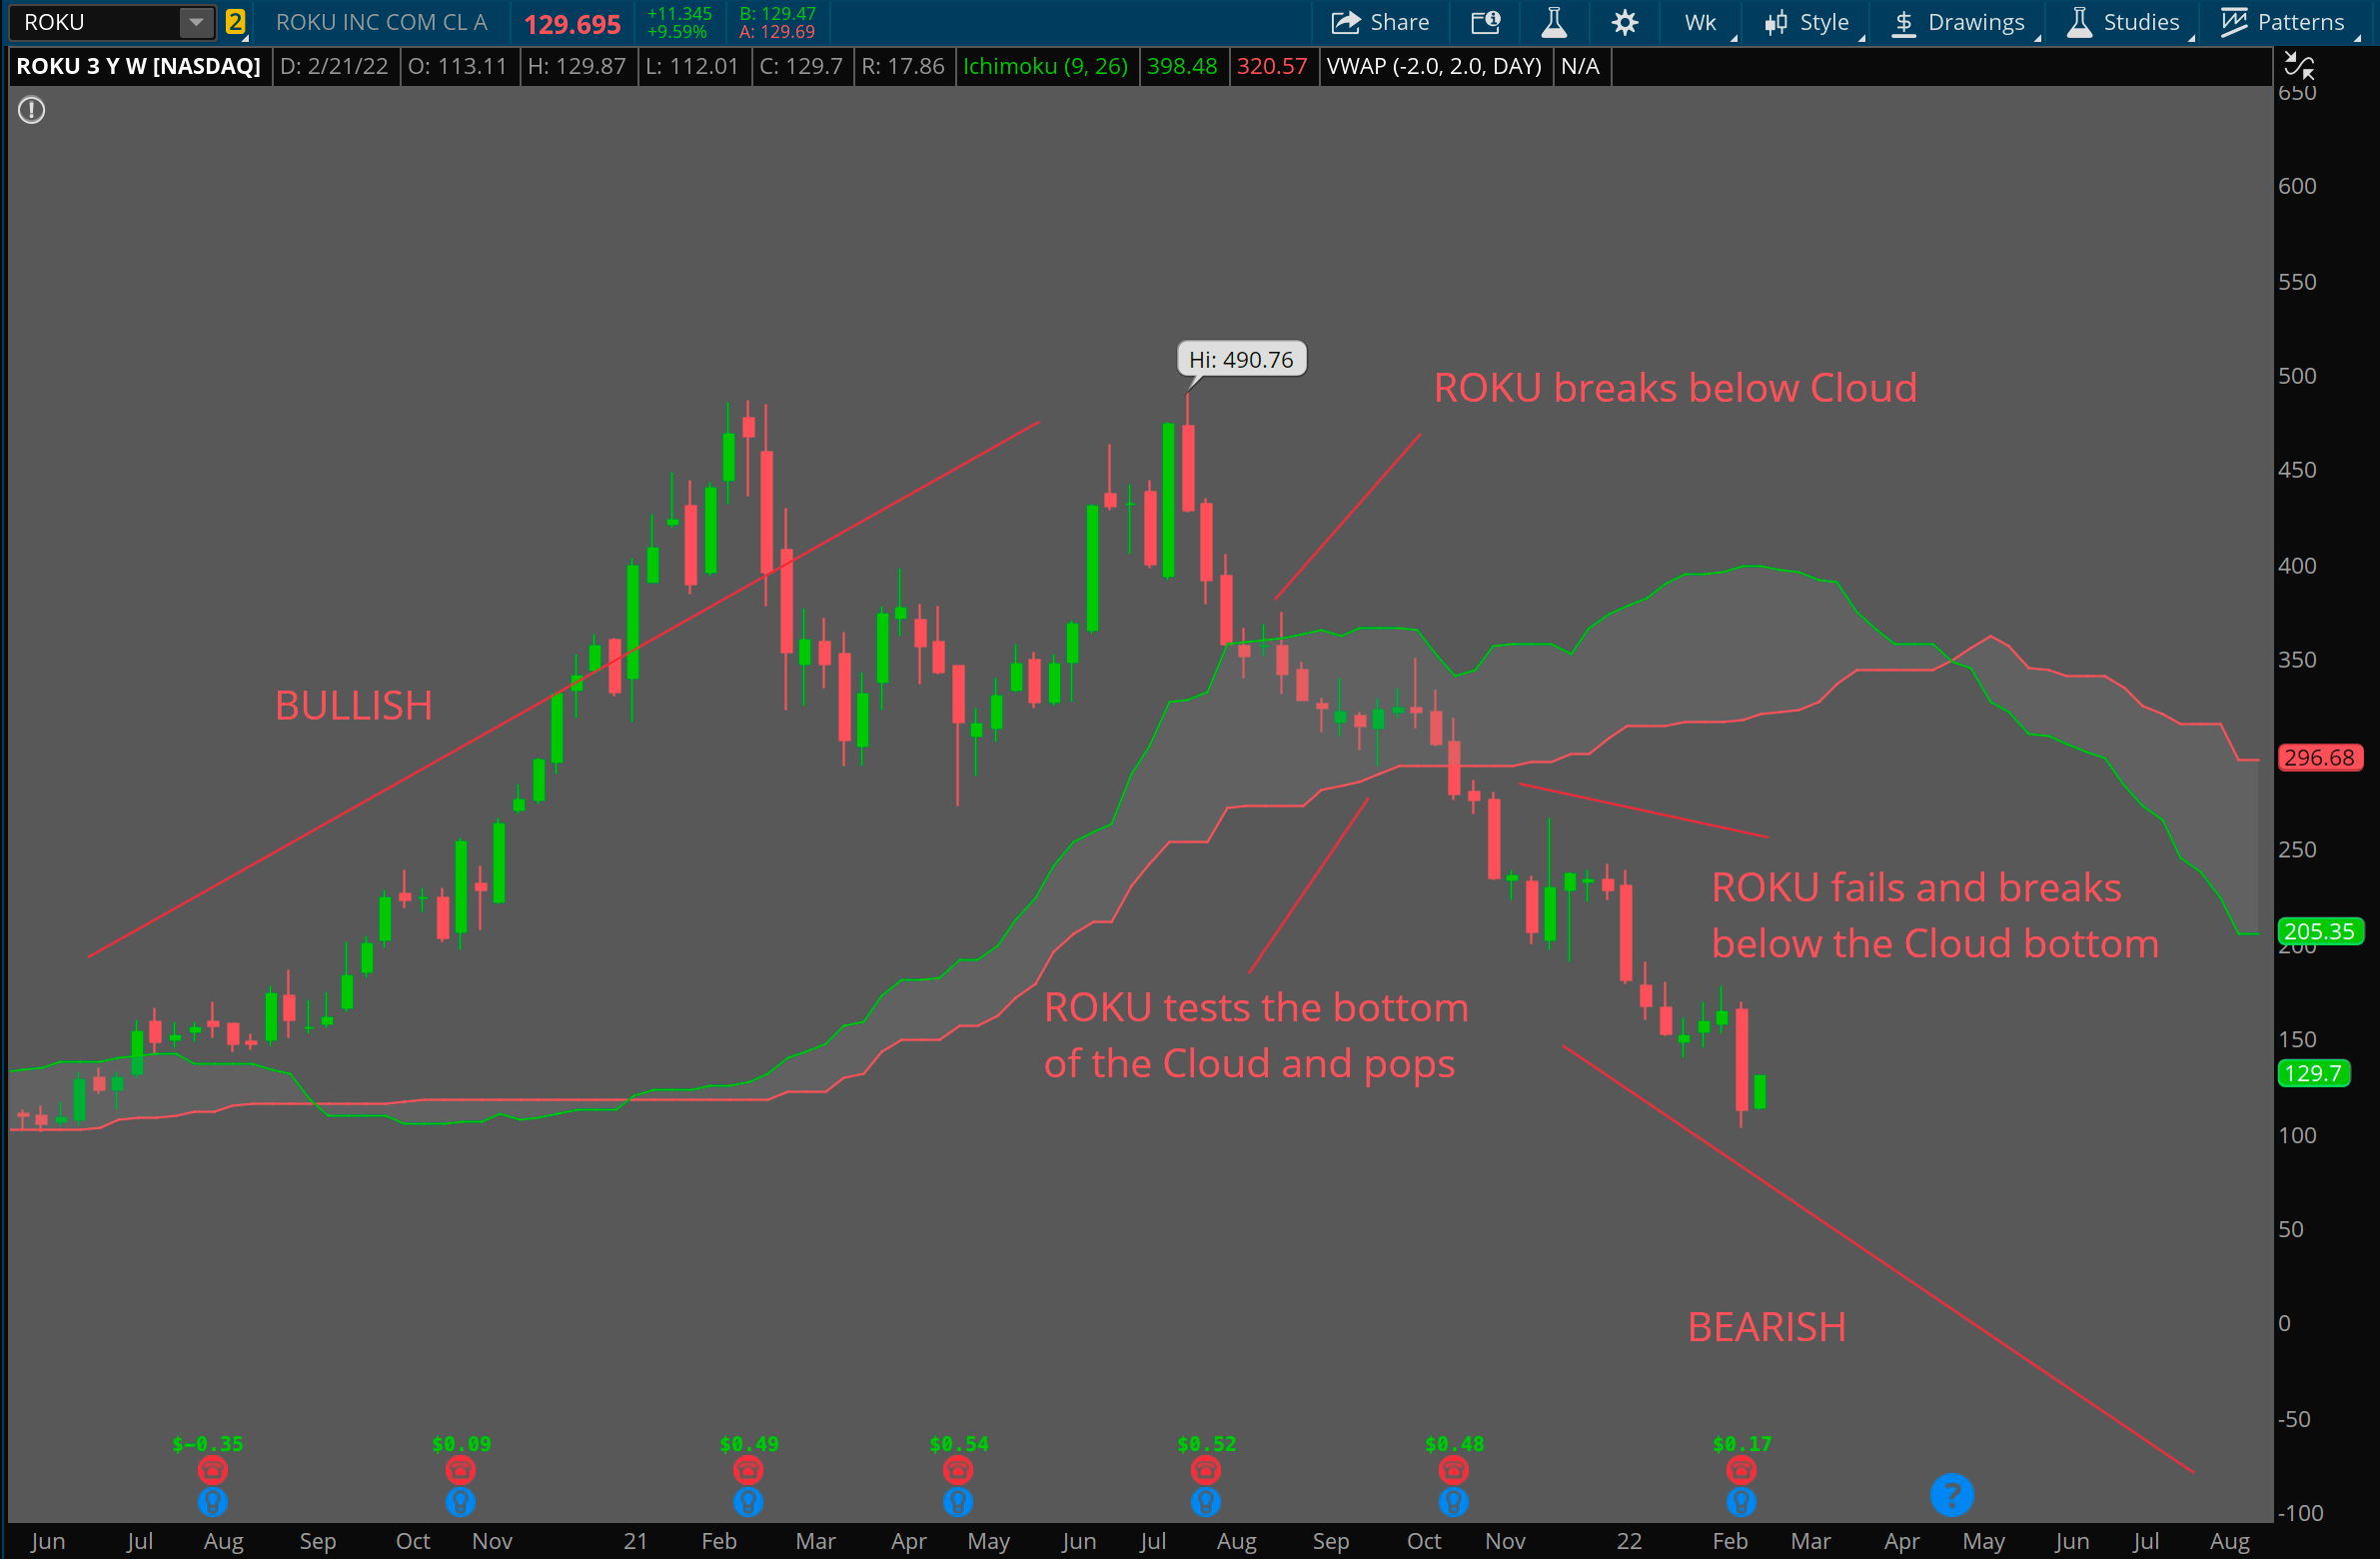
If ROKU is above the Ichimoku Cloud, ROKU is very bullish. When ROKU hits and breaks inside of the cloud, this is the first leg of reversing the trend.
After breaking inside the cloud, ROKU hits the bottom of the Cloud, pops and tries to hit the top of the cloud, and ends up falling and breaking below the cloud – starting the bearish trend.
When you’re bearish, you can short the pops when the price is at the bottom of the Cloud and falling. If you’re bullish, you can buy the dip when the price hits the top of the Cloud and explodes off of it.
In the screenshot below, you’ll see an example where ROKU clears the bottom of the Ichimoku Cloud, holds the Cloud and breaks off the Cloud from $150 to $480. This is the type of dip buy opportunity that can seriously change your trading.
When it comes to using the Ichimoku Cloud on multiple time frames, we start to really see the overall trend:

ROKU broke under the daily cloud for the first time in August 2021, so let’s see what happened to the weekly chart:

You’ll notice that once ROKU started breaking below the daily Cloud in August, ROKU also started falling inside the weekly cloud, starting the bearish trend.
These tools can truly tell you the overall trend of a stock and further emphasizes that you can’t fight the trend. If you want to go long and ROKU is dropping below the Ichimoku Cloud on the weekly chart, you know you are fighting the trend and therefore shouldn’t be entering a long position.
How to Add the Ichimoku Cloud to Your Charts
The Ichimoku Cloud is a free indicator on most trading platforms, but when you first load the Ichimoku Cloud onto your charts it’s going to look a little different. This is because Ichimoku in itself is an entire system. What I’ve realized over the years is that I only need to use the cloud.
To only show the Ichimoku Cloud, you’ll need to go to the indicator’s settings and uncheck all of the boxes titled “Show plot” for every name (Tenkan, Kijun, Chikou) except for Span A and Span B.

You can adjust the colors to whatever you’d like, but I personally prefer having the Cloud as gray.
To change the colors to look like mine, adjust your color settings to…
- Span A = Green Color
- Span B = Red Color
- Globals = Gray for Bearish and Bullish

Now you’re more familiar with the true power behind the Ichimoku Cloud and how it can give you an edge to your trading game. If this is new to you, practice patience and remember the two main uses for the indicator… To find out what the trend is on the time frame you are focusing on, and to layout key levels and inflection points that can help you determine your entries and exits.
Don’t let yourself be sidelined by wild markets, with volatility and inflation going on, the market can be pretty brutal. However here at Simpler Trading, we have a class that can help. If you’re interested in learning more about how I use the Ichimoku Cloud specifically for my Scalping strategy, check out my complete 4-hour training class here.
FAQs on the Ichimoku Cloud
Q: How reliable is Ichimoku Cloud?
A: For me, the Ichimoku Cloud has been one of the most reliable and powerful indicators I’ve used. It’s a free and available on most trading platforms. It represents the gray “cloud” that combines multiple points of data to give a current and future projection of support and resistance.
Q: When can I buy and sell Ichimoku Clouds?
A: If the price reaches the Ichimoku Cloud and hits it, this level becomes an amazing dip buy opportunity.
Q: Which time frame is best for Ichimoku?
A: “Ichimoku Cloud works great on the daily or weekly time frame. You can also use smaller time frames to gauge the trend at that moment in time.”