
Markets have two phases: trends or sideways consolidation. And, because markets have two phases, traders need an indicator that works for each one. Over my years of trading, I‘ve experimented with various indicators to try and best understand both of these phases. There are many indicators out there that try to capture the essence of a trending stock. And there are many indicators that try to capture the essence of a range-bound or consolidating stock.
With time and experience, I’ve found two indicators that work best for me and I want to share those with you in this article. When combined they provide a clear understanding of what the stock’s doing and provide signals to trade that specific phase the stock’s in. For trending stocks, I’ve found the TrendOscillator to work best for me. For range-bound stocks, I’ve found the HiLo Pro to be a wonderful addition in providing signals on when to enter or exit a choppy stock.
Do You Need More Help Trading?
Simpler Trading understands the complexity of trading. And that’s why we offer the Ultimate Indicator Bundle. It’s my newly developed indicator that helps you identify trending and non-trending markets within your charts. Get the Trend and HiLo Oscillator Pro Indicator today and start trading like a pro.
What is the HiLo Pro Oscillator?
The HiLo Pro is a supplementary indicator that we use when a stock isn’t trending – but rather in a choppy range or even a sloppy trend. Basically, anything other than a perfect trend, we can use the HiLo Pro to find trading signals. First, we use the TrendOscillator (example of the indicator in the video below).
The TrendOscillator in Action
When we see that it’s sloppy, meaning that the green line goes above and below the red line over and over, we know that’s a non-trending stock. We immediately recognize the need for the HiLo Pro to provide the trading signal. If the TrendOscillator showed a perfect trend, green over red both rising, we prioritize that and don’t need the HiLo Pro. Below you will see an example of when to use the HiLo Pro indicator.
Best Strategies to use with the HiLo Pro Oscillator
The HiLo Oscillator Pro is a momentum indicator that can be used with various different types of trading strategies. However, what sets this indicator apart from all the others, is that it can help identify oversold and overbought stocks in a non-trending mode. Below you’ll find a list of some of the best strategies you can use with the HiLo Indicator.
Trading Strategies:
- Day Trading
- Swing Trading
- Debit and Credit spreads
- Call Options
- Put Options
In the example below we can see a daily chart of Boeing (BA). We start first by looking at the TrendOscillator. We note that the red line is flat and that the green line crosses above and below the red line without any clear direction. This is the TrendOscillator telling us this is a non-trending stock and we need to rely on HiLo Pro for the signal.
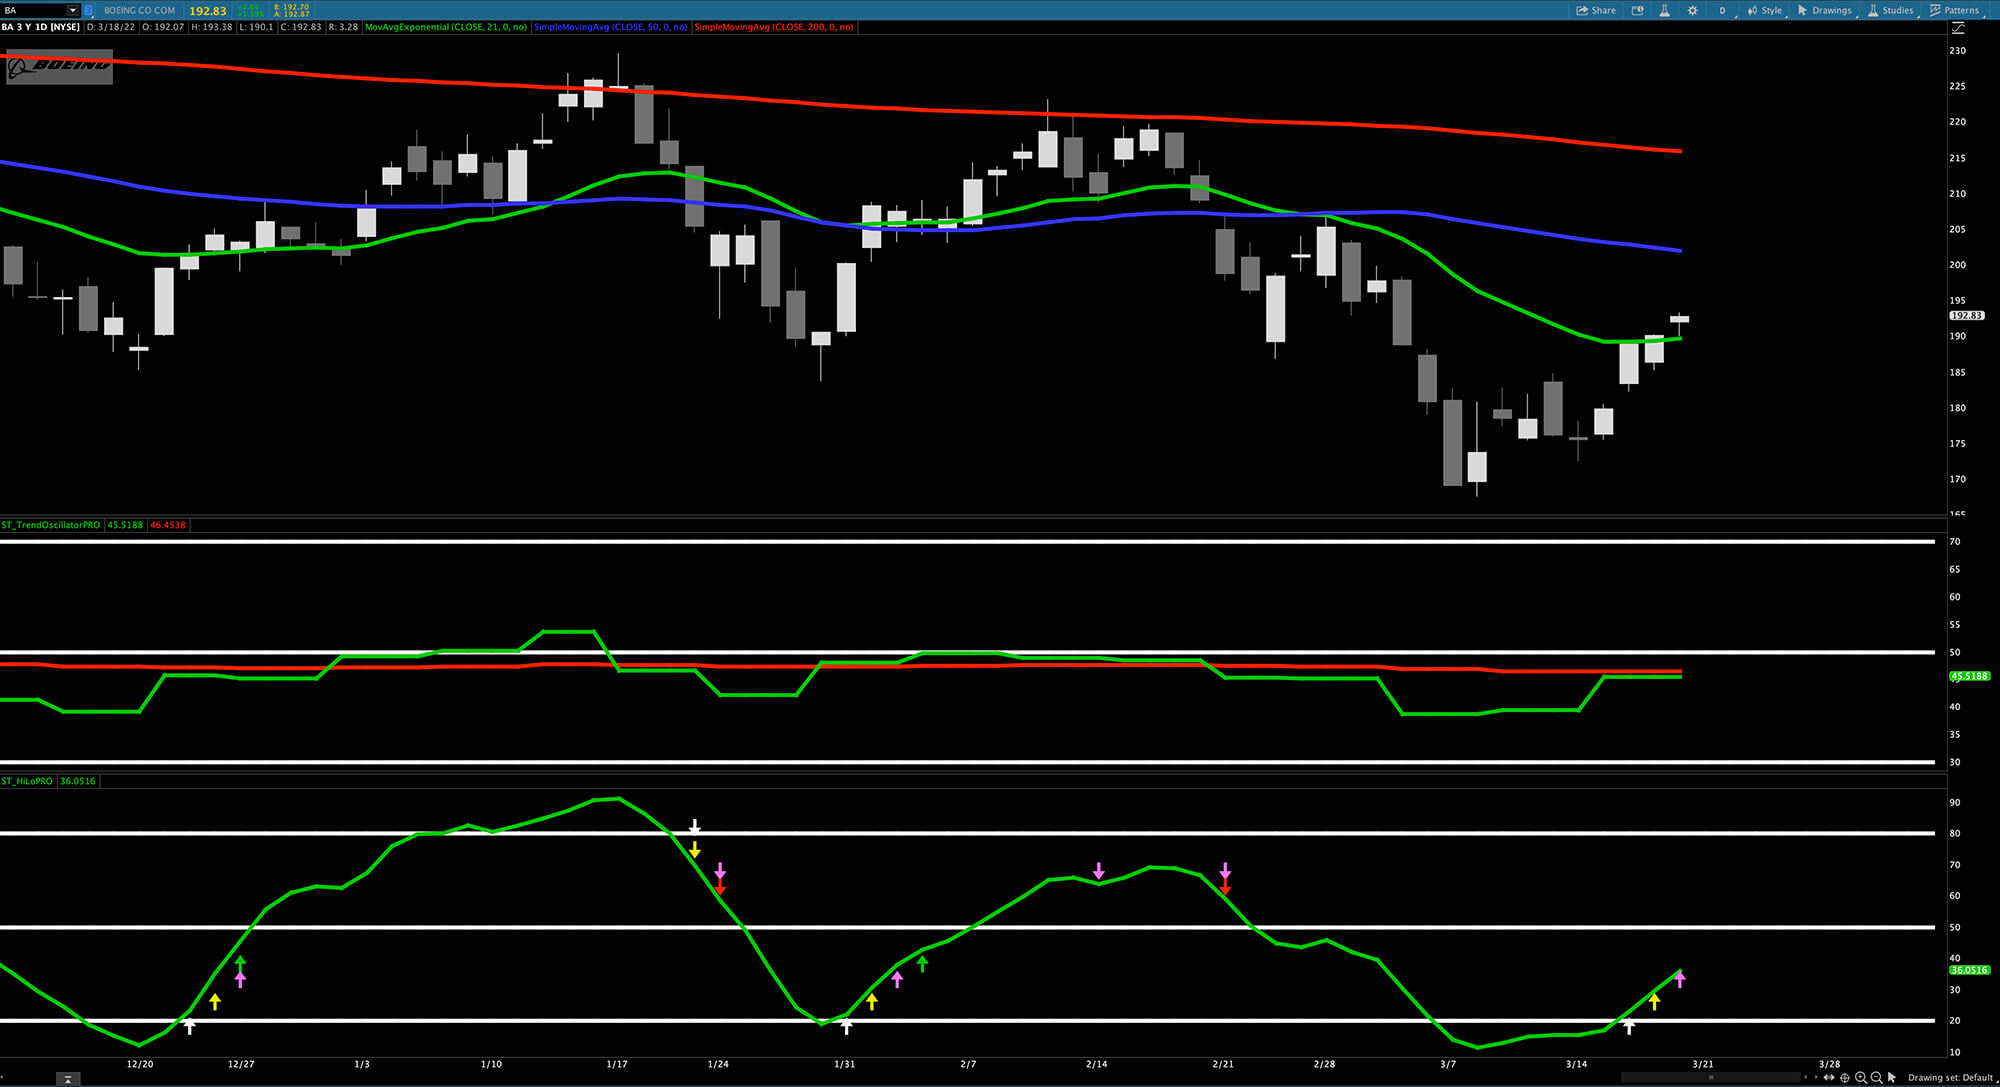
Once we understand when to use the HiLo Pro then it can work its magic in providing trading signals. The HiLo Pro is designed to catch turns in a non-trending stock. It does this by showing multiple buys or sell signals at key turning points.
The earliest signal is the white arrow. The next signal is the yellow arrow, followed by the magenta. And the green or red signal confirms the turn. Action can be taken on any one of these signals by design. A trader that notices this pattern on a non-trending stock can buy or sell on the first white arrow, the second yellow arrow, and so on.
How to Trade with the HiLo Pro Oscillator?
What the HiLo Pro seeks to capture when a stock’s in a range is these key turning points as the market plays ping pong with the stock. If we combine the HiLo Pro-signal against a support or resistance level, the effect’s even greater.
When we see a sell arrow, any color, at resistance, we can have more confidence in opening up a short trade with a stop above the resistance level where the HiLo triggered. When we see a buy arrow, any color, at support, we can have more confidence in going long with a stop below the support level where the HiLo triggered.

Here’s another example of the indicator using the stock UPS. But this time the price action doesn’t look so rangebound as it did with Boeing. It’s important to note though, that that doesn’t change the process at all. We first look at the upper indicator, the TrendOscillator, to understand whether the stock’s more in trend or range.
Despite the moving averages on UPS being mostly “stacked” (meaning the fast is above the slow and the moving average band’s rising), the TrendOscillator looks “sloppy” meaning the red line is flat and the green line crosses above and below. This tells us that UPS should be treated as a non-trending stock. Despite the fact that there’s somewhat of a trendy look to the moving averages.
So what do we do when we have a non-trending stock confirmed by the TrendOscillator? We rely on the HiLo Pro for the signal. In the same way that we looked at Boeing as a ping pong situation where we buy the up arrow and sell at the down arrow, we do the exact same process on UPS. This allows us to trade stock and effectively play ping pong with the market at key inflection points. We can do this indefinitely as long as the signal stays the same. If the TrendOscillator begins to show trending properties then we stop trading the stock like its rangebound and re-evaluate the strategy with the new information.
Trading with the HiLo Pro Oscillator and TrendOscillator Pro
Notice that we use both indicators in conjunction with each other. The TrendOscillator is powerful enough to be the primary signal for anything trending. But when it doesn’t look perfect, as in the two examples shown, we have a reliable and highly effective secondary indicator for these moments in time when the market’s stuck in indecision and the price action resembles ping pong.
In your journey as a trader, it’s important to remember this dynamic regardless of what indicator you use. You’ll need a primary trend indicator, and when that indicator shows a non-trending situation, you’ll need an equally powerful range indicator to provide the trading signals to follow. When you combine both the TrendOscillator and HiLo Pro you have a simple, yet powerful duo of indicators that’ll allow you to trade any market for your entire career.
Are the HiLo and Trend Oscillator Pro Difficult to Understand?
Simpler Trading knows the struggle of getting a new indicator and not being able to fully understand how it works. That’s why they’ve created my Ultimate Indicator Bundle. You not only get the indicators we’ve been talking about in this article, but you get access to the strategy class, the e-learning module, and the HiLo Pro Bear and Bull scans. So, that way if you ever get lost using the indicators, Simpler Trading can guide you on the right path.

FAQs About The HiLo Pro Oscillator
Q: What Platforms Can The HiLo Oscillator Pro be used on?
A: Simpler Trading would recommend using the indicators on platforms such as tastytrade, thinkorswim, or TradeStation. If you are unsure if your preferred platform will be able to accept the indicator, then you might want to call the platform’s customer service representative to be sure.
Q: Can The HiLo Oscillator Pro be used with any other indicators
A: Yes, it pairs perfectly with the TrendOscillator Pro, in fact, it’s designed for the indicators to work together. You can purchase the Ultimate Indicator Bundle in the Simpler Trading store.
Q: What kind of Indicator is the HiLo Oscillator Pro?
A: It’s a momentum indicator that identifies oversold and overbought stocks, in a non-trending condition. It helps the trader pinpoint when to execute trades.
