The Yield Curve — The Market Puppet Master

Sam
4 min read

Lately the market has seen a strong rotation from momentum technology stocks to small cap, value stocks.
We haven’t seen this dynamic in such a lasting way in at least ten years, so what’s going on? What is making small caps more attractive to traders in the current environment than the megacap tech stocks which led the rally for years?
I believe the answer is found in the yield curve. Let’s take a look at a couple of charts to find the relationship between what is going on.
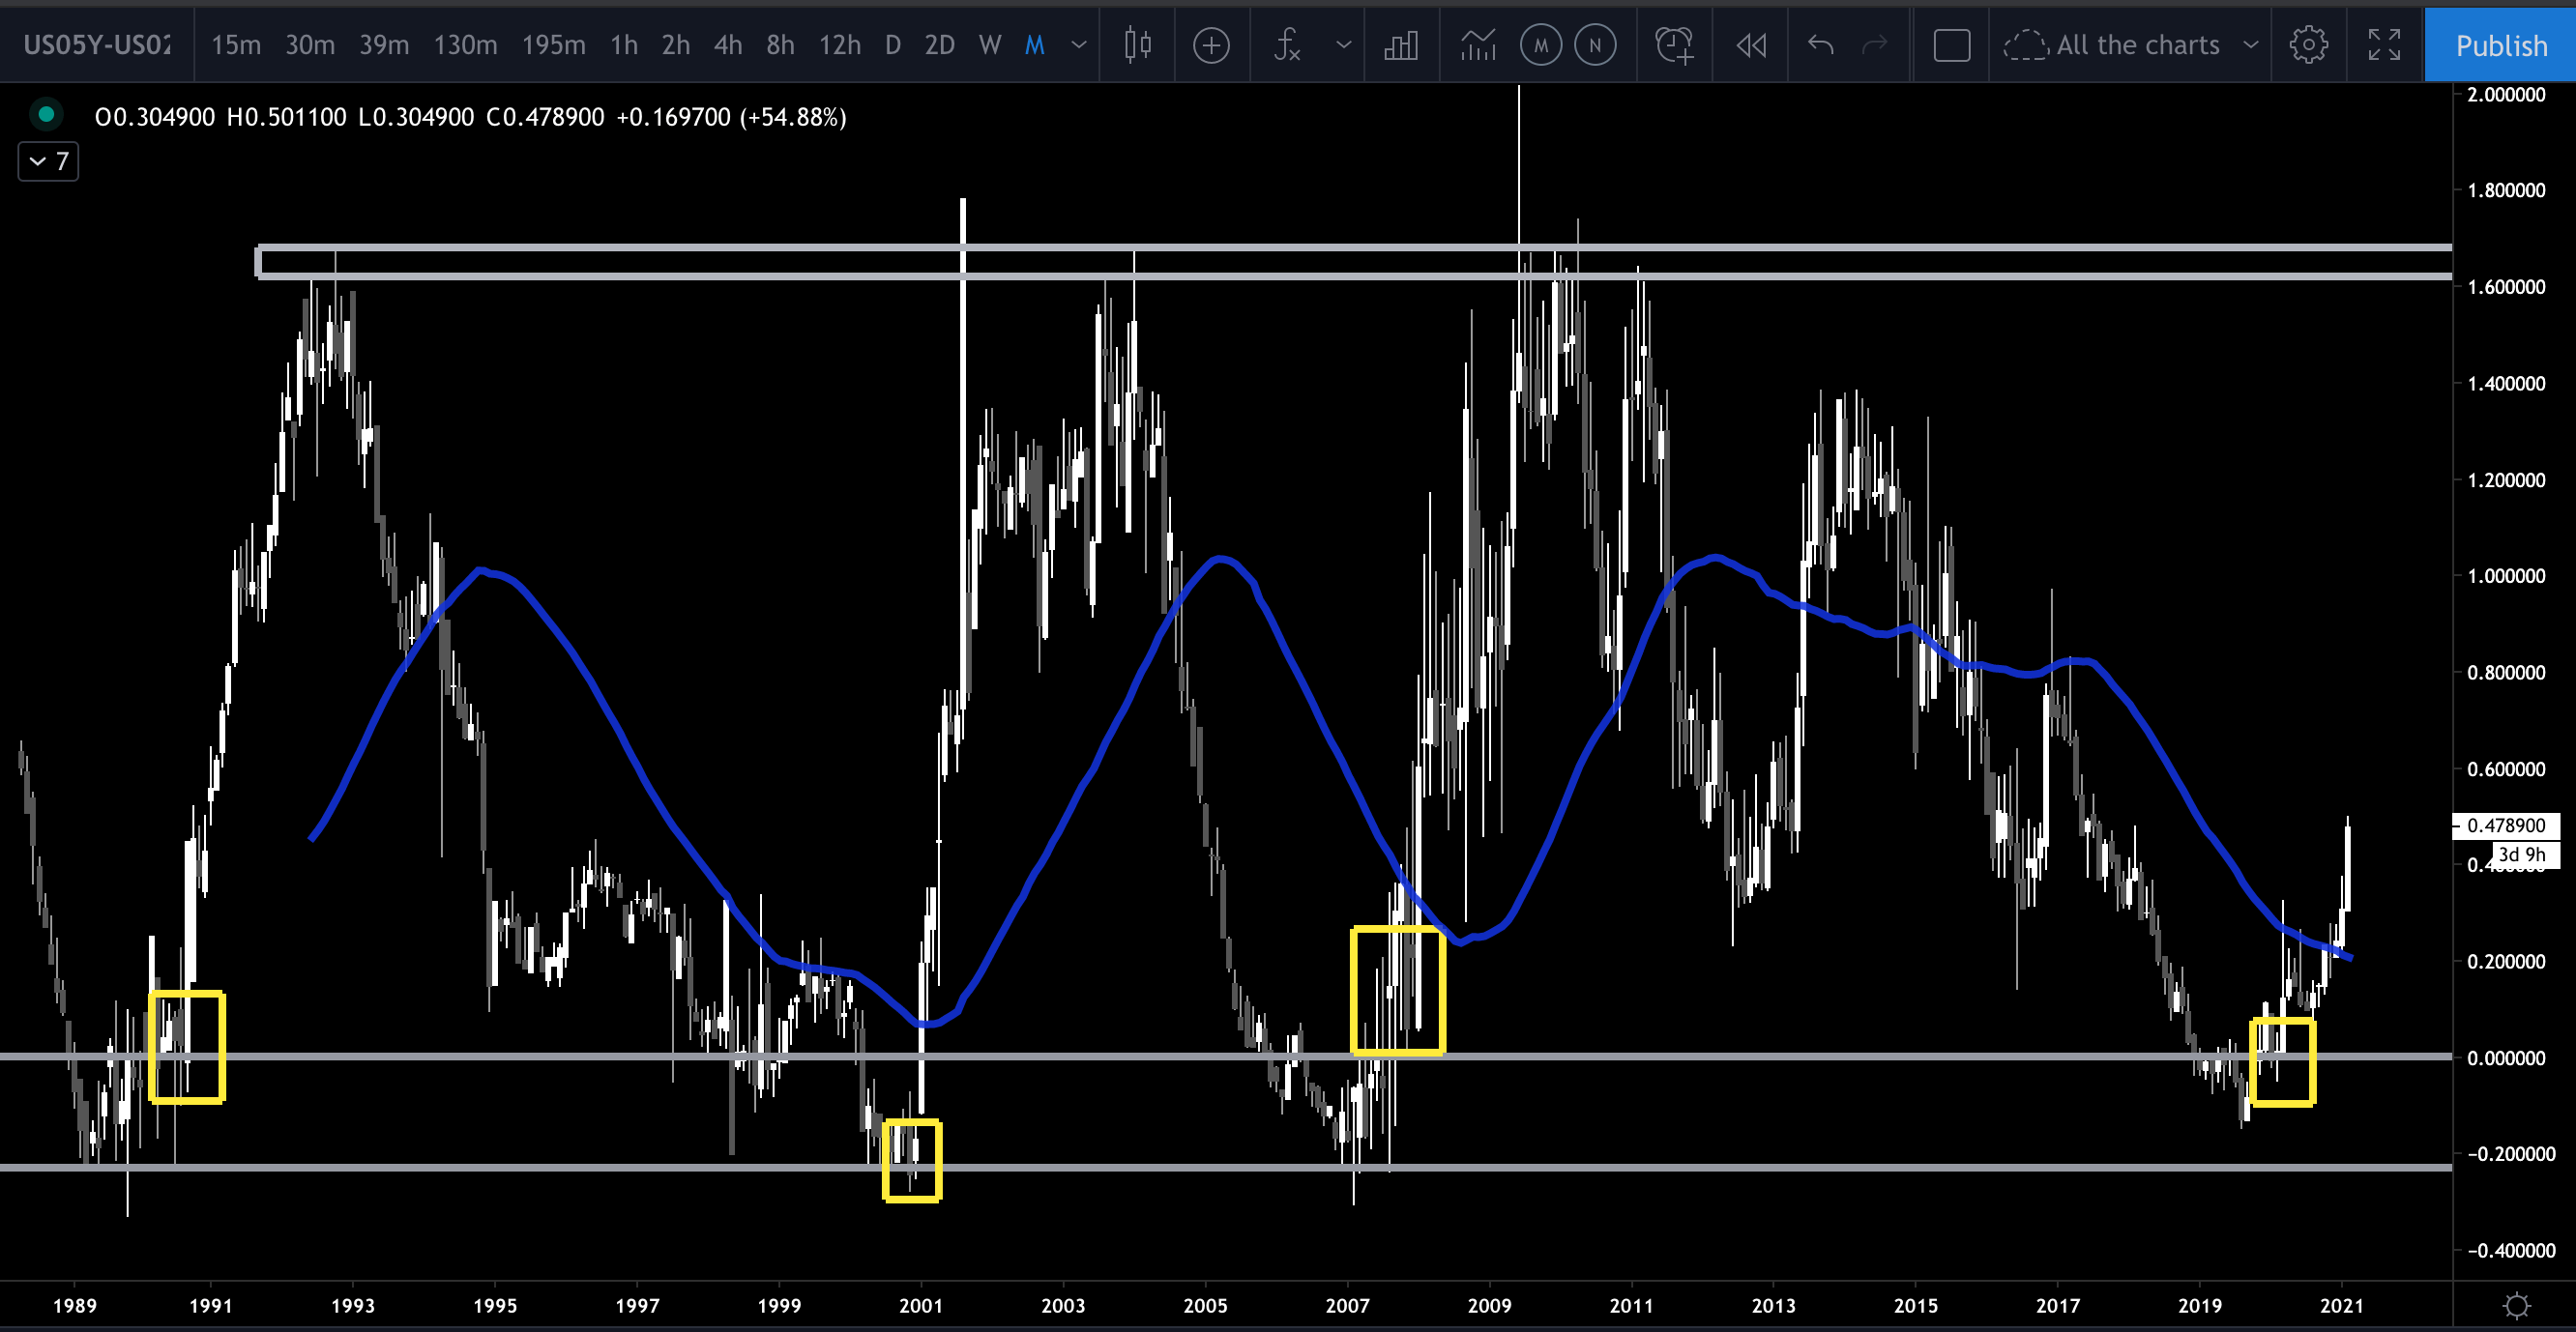
Below is a chart of the yield curve. I am using the 5-year minus the 2-year interest rate, but most people will use the 10/2yr or the 10y/3mo. I am a fan of both, but for the sake of explanation, the one we are using gives the ‘cleanest’ look.
A brief key to understanding the chart: The lower gray box shows where interest rates are inverted. Inverted rates mean that it costs more to borrow short term than it does to borrow longer term. Imagine if you could borrow for ten years at 2%, but if you wanted to borrow for two years it would cost 3%. This would lock in a loss of 1% for entities that borrow long and lend short, i.e., banks.
When rates are inverted, it is almost impossible for banks to make money. It’s no different than buying hot dogs for $2 and selling them for $1—it’s a great way to lose money.
We can see that the curve has been inverted four times in the last thirty years. Each time the curve has inverted, historically it has then ripped higher to the upper zone before slowly falling back to inversion and repeating the process over decades. It is very likely we will see a retest of these previous high zones before anything changes with historical precedent.
What the banks don’t like, momentum technology stocks love. Momentum tech thrives in an environment of very cheap money and so momentum tech becomes the only alternative when the yield curve inverts.
To simplify, when the curve is near the bottom banks cannot make money, but money is so cheap that momentum technology stocks can thrive. As the curve rises out of inversion and goes higher, that increases the profitability of banks but the rising expense of money/credit tends to hurt momentum technology.
So are we seeing this dynamic play out in the market? The answer is yes. We have seen a historically large rotation out of mega-cap technology to small caps and reopening stocks which are seen as “value.” Let’s take a look at another chart which shows this dynamic over a long timeline.
Below is a chart of the RUT/NDX that goes back roughly thirty years. As this chart trends lower, that is technology being favored over small caps. As this chart trends higher, that is small caps being favored over technology. We can see that the last time the ratio got so out of whack was in the dot-com era around 1999-2000. Over the previous decade, we can see this ratio slowly trending lower and lower, and then finally over the previous two years the ratio falls off a cliff back to the dot com lows. This signifies a strong, decade-long preference by traders to buy momentum tech over small cap value.

By putting these two charts together, the yield curve and the ratio of tech to small caps, we get a complementary picture of what the market sees ahead.
Both charts show the potential for continued rising. Yield curve has not come close to historical resistance levels and the RUT/NDX ratio has a way to go as well before it hits resistance.
These dynamics take years or even decades to play out, and it is very important as traders that we understand these tectonic shifts in the market and adjust our trading plan accordingly.
These same charts will give us a major signal when they do finally turn but, until that time, it is important to have a solid understanding of what is driving the market mechanically underneath the surface.
FAQs
Q: What do yield curves tell us?
A: A yield curve plots how the yields on instruments like bonds against the years remaining to their maturity.
Q: Why is the yield curve important?
A: It is important to watch whether a curve is inverted or not. Inverted rates mean that it costs more to borrow short term than it does to borrow longer term.
Want to hear more from Sam? Get his High Level Market Overview Delivered to Your Inbox Every Sunday.
