Three is a Magic Number

HG
5 min read

One of the most important signals driving today’s market is one you may not be familiar with. Most traders begin their technical trading with daily charts. Then they branch off into intraday or weekly, maybe even monthly charts. One that’s not so often discussed is a 3-day chart. 3 is a magic number for a number of reasons. Nikola Tesla is quoted as saying “If you only knew the magnificence of the 3, 6 and the 9, then you would have a key to the universe.” I don’t know that I’m going to claim I’ve found a key to the universe, but I have found a key to successful trading, and it begins with the 3-day chart.
Do You Need A New Trading Strategy?
Trading strategies are one of the most important things to have while trading in the market. And Simpler Trading more than anyone else understands that necessity. And that’s why we offer the Voodoo Masters Strategy. Sign up today to become a member and get immediate access to monthly live trading sessions, real-time trade alerts, and Henry’s trade spreadsheet. Join today only at Simpler Trading.
A 3-Day Chart With the Squeeze Pro
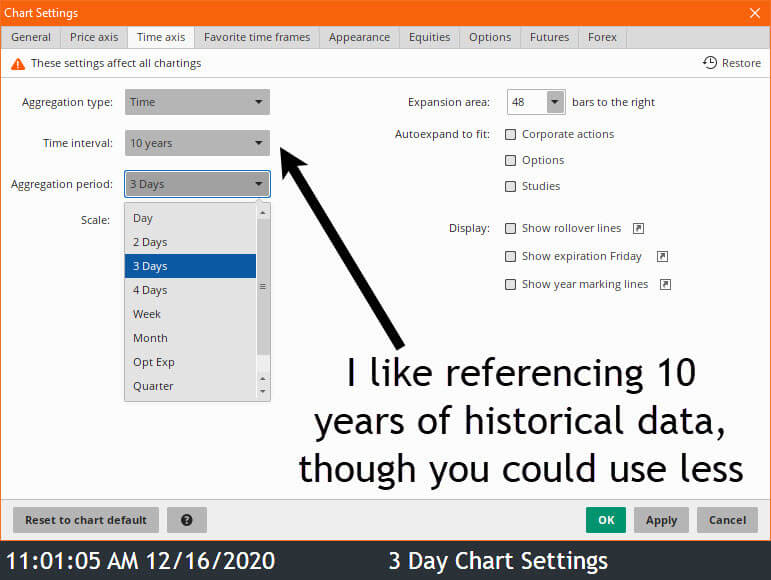
A 3-day chart isn’t a revolutionary concept. The aggregation period has been available in thinkorswim for some time. But it hasn’t been a dedicated part of my trading plan until recently. I generally reference 10 years of historical data, though you can get the same signals using fewer time frames.
Once we’ve got our chart showing 3 cash sessions as a single bar. We add the Squeeze Pro (though you could use the OG Squeeze). And the 8 and 21 EMA (using MovAvgTwoLines in thinkorswim will save you time in applying them to your chart).

With this basic setup prepared and Nikola’s quote in mind. It’s fitting that the first chart we review is the 3-day chart of Tesla. The clean energy pioneer has enjoyed a banner year in 2020, rising more than 600% and crushing skeptics along the way. The most recent leg (the move from $400 to $650) is something I’ve been calling for based on this 3-day signal.
I feel like 3-day charts are the Goldilocks timeframe of trading. Daily charts can be noisy. Weekly charts can take forever to play out. By referencing the 3-day chart, we’re right in the middle and in a great position to take advantage of trending moves 60 to 90 days out. Notice how Tesla moves perfectly through all 3 phases of compression in this most recent example.

Low into Standard then High, then reverses back through each of those triggering them along the way. Then ultimately firing long as the Bollinger Bands pop outside the Keltner Channels and the dots of the histogram return to green.
Trading AAPL with The 3-Day Chart
Having seen the results of the Tesla 3 day Squeeze, you can see why I’m interested in the 3-day Squeeze in AAPL. Apple announced this week that they’d be ramping up production of the iPhone in the first part of 2021. I can only imagine how many pairs of those $600 headphones they’re going to sell.
Whatever headline you’d like to give it, the technical structure of AAPL has it set to clear the current lifetime high of $137.98 and head on to $150. The important thing to understand is that at the current price of $127, there’s about $10 of premium to a current entry.

We want to pay what the 21 EMA is while we’re in the compression phase of the Squeeze. Anything bid above that must be recognized as the premium that has the potential of contracting if shares were to revert to the mean. The 3-day Squeeze gives us the 40,000-foot view, then we come back down to a street level to manage on a daily basis.
Trading Docu with the 3-Day Chart
While we’re on the topic of premium, how about that housing market. My wife Mandy and I have been looking for a new home, apparently with everyone else on the face of the earth. And you can pretty much guarantee that if you find something you like it’s going to carry a decent premium.
So many of these “Zestimates” alert you that “something seems wrong here.” Prices are so much higher than what the service thinks they should be going for. At the risk of making a drawn-out segway, what are people using to close these deals? I know at least one of them that’s using Docusign, and I’m willing to venture a guess that there’s more than that. All opinions on the housing market aside, we’ve got a great technical signal in the 3-day chart of DOCU.

DOCU currently carries a slightly lower premium than AAPL. Trading just 8% above its 21 EMA but just like AAPL, also has great prospects of clearing its current lifetime high.
The list goes on, and we could spend more time on examples in FB, NVTA NVDA, HD, NFLX, AMZN, and CMG. But ultimately it’s up to you to understand the setup and the results it can provide. To know that it’s one of the most important signals you can track into next year, and work to leverage its power to your advantage.
Looking for Help in your Trading Career?
Luckily, Simpler Trading offers Henry and David’s Voodoo Masters Strategy where if you sign up today, you get immediate access to live trading with Henry and David, real-time trade alerts, and their very own trade spreadsheet. So, sign up today and never trade alone again.