A Guide to Fibonacci Retracements in Trading
Fibonacci retracements have become widely used among traders to predict support and resistance levels based on past price action. Here is an overview of Fibonacci retracements and how to start using them in your trading.
What are Fibonacci Retracements?
The term “Fibonacci” comes from the famous Italian mathematician, Leonardo Pisano. Pisano’s nickname was Fibonacci and his most famous and significant contribution to mathematics was the discovery of the Fibonacci sequence. To explain the formula in its most basic form, the Fibonacci sequence starts with 0 and 1, then each number is the sum of the previous numbers. For example, the sequence goes as follows:
0, 1, 1, 2, 3, 5, 8, 13, 21, 34, 55, 89, 144, 233, 377, 610, 987, and so on, continuing indefinitely.
Each number in the sequence is about 1.618 times greater than the number that came before; the larger the number, the more precise it is to the 1.618 multiple. This number, 1.618, is referred to as the Golden Ratio–also known as Phi–and is considered the most irrational number in mathematics. Interestingly, it appears frequently in nature, such as in the wings of a butterfly, the shell of a mollusk, the structures of many kinds of flowers, and even the tail of a chameleon.

Fibonacci retracements are important trading indicators that were derived, not from the Fibonacci sequence, but from the relationship between the numbers in the sequence themselves. The retracement levels are based on percentages. They provide price levels of support and resistance where a potential reversal in direction could happen. They can be used to establish entry and exit points for your trades.
To see the relationship between Fibonacci numbers is pretty simple. We already know that each number is 1.618 more than the previous in the sequence (i.e., the Golden Ratio). For trading, the more important relationship is found in the percentages when you divide a number by subsequent numbers in the sequence.
When you divide one number in the sequence by the number immediately to it’s right, you’ll get .618 or 61.8%. This is the inverse of the Golden Ratio. That is the first of three percentages used by traders in Fibonacci trading. The other two are 38.2% and 23.6% respectfully, but why these numbers?
- 38.2% is derived from dividing a number in the Fibonacci sequence by the number two places to the right.
- 23.6% is the division of a number by the number three places to the right.
Here’s an example of the math
- 89, 144, 233, 377 are all in sequence
- 89/144 = .618 or 61.8%
- 89/233 = .3819 or 38.2%
- 89/377 = .2360 or 23.6%
How are Fibonacci Retracements Used in Trading?
The stock markets are based on patterns and trends, many of which are derived from mathematical theories. If the Golden Ratio is found in nature, then why not the markets? To be able to recognize a Fibonacci retracement is to pinpoint a completed trend within the market. You can then set your retracements and apply the Golden Ratios of 23.6% 38.2% and 61.8%. Below you will find an example of Fibonacci at work and learn why it’s popular among traders.
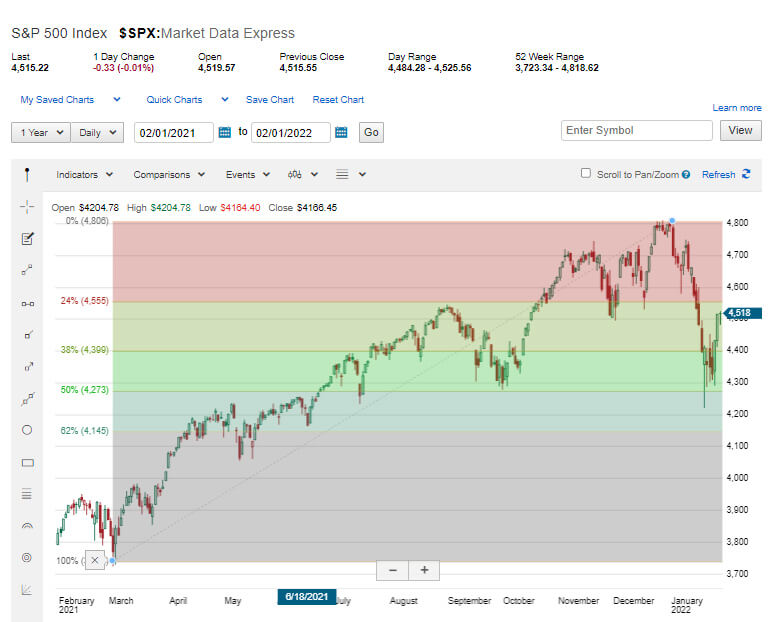
The example below shows the S&P 500 Index fund with the golden ratio being utilized, you can see in the chart that the resistance levels are in red indicating a selling point and the support levels are in green which indicates a buying point. Please note: the Fibonacci indicator cannot tell the future, it does not take into account of current events or spontaneous market trends that no one knows about. However, it can assist with finding levels of support and resistance for potential buying opportunities.
How To Use Fibonacci Retracements
Fibonacci retracement levels are illustrated by taking high and low points on a chart and marking the three most important Fibonacci ratios of 23.6%, 38.2% and 61.8%. These lines are placed horizontally creating a grid. The graph is then created by taking two extreme points on a chart (usually the lowest and highest points) and dividing the vertical distance by the Fibonacci ratio percentages. For example, you can see in the chart above, we took the SPX low of $3,750 and high of $4,800 and made those our pinpoints.
It’s important to note that retracement levels don’t have any formulas. The user of the indicators chooses two points on a chart. When those two points are chosen, the lines are drawn at the Fibonacci percentage. Fibonacci retracements are used to set price targets, determine stop-loss levels, and place entry orders.
A trader might see a stock move higher on the chart. When it moves up, it retraces to the 61.8% level. That’s why it’s called retracement. Depending on the direction the market goes in, prices will retrace a significant part of a previous trend before moving on to the original direction.
In order for you to find Fibonacci retracements levels, you have to find a low price and connect it to a significantly high price. There are trading platforms available that have Fibonacci line tools capable of assisting you. It’s a simple matter of selecting the low price and dragging the cursor over to the higher price. The indicator will mark the key ratios automatically on the chart.
For the downtrend, you might do the opposite. Click on the high point and drag the cursor over to the low point. If you want to know if there’s a strong uptrend, you use Fibonacci to measure each pullback of the security you’re trading. As an example, if you see new high points with retracement levels of 50% or less, that usually means you are in a strong uptrend.
How to Get Started Trading with Fibonacci Trading
So, if you want to learn how to trade with Fibonacci retracements, there’s a few things you’ll need to know. Your first step is to pick out your trading platform to build your charts. thinkorswim, tastytrade, and Tradestation are all popular options to getting started and using the Fibonacci method. They all have built-in Fibonacci tools to calculate percentages and plot them on your chart. You may want to test them out to see which one works best for you.
No matter the experience level, Simpler Trading is filled with courses, resources, tools, and mentors to help traders leap up through the learning curve and sharpen their skills. For Fibonacci retracements, our veteran traders specialize in teaching Fibonacci trading strategies in our live Fibonacci trading room.

FAQs on Fibonacci
Q: What are Fibonacci retracements?
A: Fibonacci retracements are trading indicators derived but from the relationship between the numbers in the sequence themselves.
Q: How do Fibonacci retracements work?
A: The retracement levels are based on percentages and provide price levels of support and resistance where a potential reversal in direction could happen. They can be used to establish entry and exit points for your trades.
Q: What are the Fibonacci numbers in trading?
A: Fibonacci numbers relate to Fibonacci sequences. A Fibonacci sequence starts with 0 and 1, then each number is the sum of the previous numbers. Many traders use Fibonacci numbers for their moving average settings, like 8, 21, 34, and 55.
Q: What is the golden ratio Fibonacci?
A: “Each number in a Fibonacci sequence is about 1.618 times greater than the number that came before. 1.618 is referred to as the Golden Ratio–or Phi.”