How to GRaB 1000 Pips Utilizing Essential Indicators

Sam
5 min read
In this post:
-
- How to GRaB 1000 Pips utilizing essential indicators?
- What are some of the key tools to keep your trades simple and cut through the market noise?
- What do the colors of GRaB candles mean?

How to GRaB 1000 Pips Utilizing Essential Indicators
34-EMA Wave
GRaB Candles
Modified Darvas
“I am not a systems trader, but I am systematic.” -Raghee Horner
Knowing how to use indicators correctly are some of the key tools to keep your trades simple and cut through the market noise.
The actual instrument (stocks, futures, commodities, forex) is irrelevant to these indicators. As traders, we strive to trade the psychology of price levels not the news or the noise. The 34-EMA Wave, GRaB Candles, and Modified Darvas allow us to anchor ourselves to a systematic approach and then build on that foundation.
The simplicity and effectiveness of these indicators is enough to be profitable and to systematize our entries and exits.
To learn more about using these tools, check out this FREE class by our resident Futures & Forex expert, Raghee Horner.
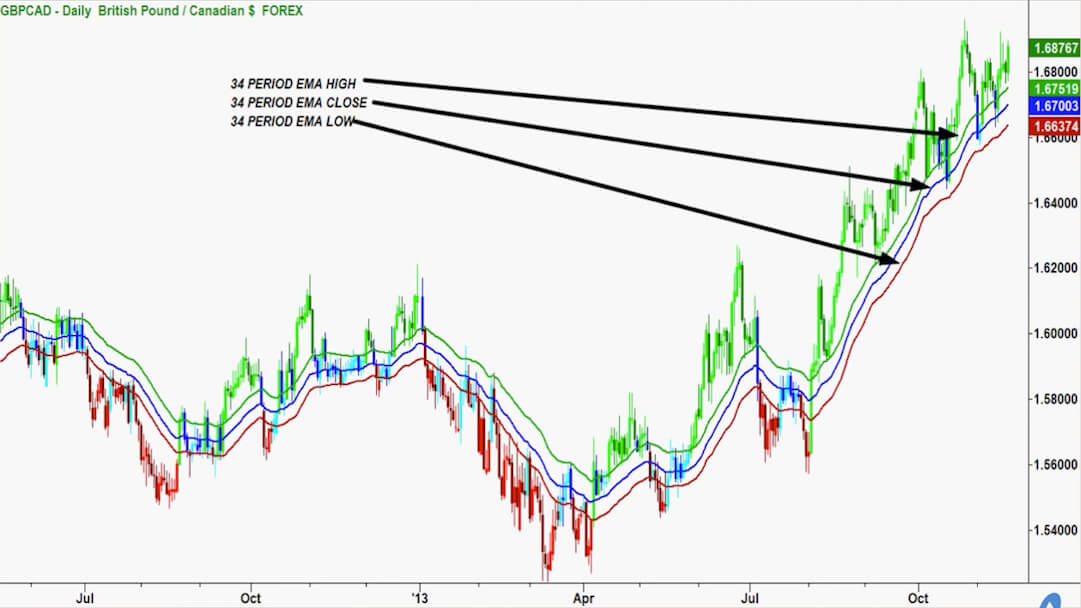
How to plot the 34-EMA Wave
The 34-EMA Wave plots three exponential moving averages, EMAs.
* 34-bar EMA of the price high, plotted green by default
* 34-bar EMA of the price low, plotted red by default
* 34-bar EMA of the price close, plotted blue by default
The 34-EMA Wave serves two purposes. Identifying a trend and understanding momentum and sentiment. The second is that the moving averages of the 34-EMA Wave act as dynamic support or resistance.
(Click on the image below to enlarge)
GRaB candles – What do they mean?
• GRaB candles are painted candles that show the relationship between the 34-EMA Wave and price.
• The wick of each colored candle represents the price range and the body of the candle shows the open and closing price.
• Each color; green, blue, and red show where the candle closed within the context of the 34-EMA Wave.
*A candle paints green when price closes above the 34-EMA of the high…
Green candles dominate a market that is moving upwards with higher highs and higher lows.
*A candle paints red when price closes below the 34-EMA of the low… Red candles dominate a market that is moving downwards with higher highs and lower lows.
*A candle paints blue when price closes between the 34-EMA high and low… Blue candles will dominate in a market that is in consolidation or chop.
Quick shifts between green, red, and blue candles are a sign of volatility and congestion. The psychology of a congested market is one of indecision between buyers and sellers and is marked by sideways EMA Wave and choppy trading.
The 1000 Pip Trade…
Using the 34-EMA Wave and GRaB Candles + Modified Darvas (Horizontal support or resistance at previous swing highs and lows) I was able to scale into a sizeable trade in EUR/USD. Analyze the screenshot below to see how I put this trade on over time and rode the trend and momentum up 1000 pips.
(Click on the image below to enlarge)

Steps to set up a +1000 Pip Trade
• Utilize the 34-EMA Wave and GRaB Candles + Modified Darvas
• Identify the trend using the 34-EMA Wave and GRaB Candle indicators.
• Follow the green candles that indicate demand marked by upward, and consistent, buying pressure on price as traders buy the retracements back to the 34-EMA high (green line)
• Scale into a sizeable trades like EUR/USD
• Position on retracements to zones where we have seen prior horizontal support – Modified Darvas and a rising 34-EMA Wave
Understanding the 34-EMA Wave, GRaB Candles, and the Modified Darvas indicators to navigate the markets in any asset class
Indicators are merely an interpretation of the most important variable on a chart, the price. What makes Wave, GRaB, and Modified Darvas so powerful is that they can be applied to any market on any timeframe and allow for consistent interpretation of sentiment and momentum.
As traders, we want to know how to effectively use indicators for information to find tradable setups, good price entries, and to set exit targets.
Learn how to use theses indicators to find trades and make profitable decisions with Raghee’s class!
FAQs
Q: What is pip in trading?
A: Pip – percentage in point – measures the change in the exchange rate of two currencies.
Q: What are GRaB candles?
A: GRaB candles are a trading indicator represented by painted candles that show the volatility and congestion in the market. The wick of each colored candle corresponds to the price range and the body of the candle shows the open and closing price.
Q: What is the 34-EMA Wave?
A: The 34-EMA Wave plots three exponential moving averages (EMAs) and serves two purposes: identifying a trend and understanding momentum and sentiment.
Here at Simpler Trading, we understand that trading can be overwhelming, but we have experienced professionals that can help. Sign up today and join us in Simpler Free Trading Room for learning center, live trading and trade alerts. Don’t trade alone again.