How to use the Divergent Bar Indicator

Allison Ostrander
9 min read
The Divergent Bar can help determine the potential move of one (or up to 3) bars into the future. It is a tool used to identify if you will see potential higher prices or price drops within the next three bars. Depending on the time frame, you can use this tool to make for some great short-term trades that you may only hold overnight or even longer-term swing setups. The win rate using my Overnight Profit Strategy with this indicator remains above 80%.
As much as I like the Divergent Bar indicator, I also recognize that it has a lot of information to digest, especially for newer traders. And not knowing exactly what to do and how to use the indicator is a common issue among traders. But that’s why Simpler Trading offers my Profit Recycling Mastery to help and mentor traders just like you. Sign up today and gain access to live trading sessions and get real-time text alerts and follow along with the stocks I trade.
A Video Guide to Divergent Bars
What are Divergent Bars?
Divergent bars are upward or downward periods in a stock going opposite the market trend. There are two types of divergent bars: the bullish divergent bar, and the bearish divergent bar. However, it’s a great way for traders to conduct their technical analysis of the stock market. And below we are going to go over each indicator in detail, so that way you can analyze the market like a professional.
Bullish Divergent Bar
A bullish divergent bar signals a potential move to a higher high compared to the high of the bar forming the bullish divergent bar. This higher high typically happens within the next bar but can take up to 3 bars to follow through on the signal.
For example, for a bullish divergent bar, we will typically see some sort of higher high within the next 3 bars compared to the bar that was printed. This is why I like to give myself some time in the expiration to allow for those three bars to print. On a daily chart, this means waiting to see a higher high within the next 3 days, to allow the trade to follow through.

Bearish Divergent Bar
Alternatively, a bearish divergent bar signals a potential move to a lower low compared to the low of the bar forming the Bearish Divergent Bar. This lower low happens within the next bar but can take up to 3 bars to follow through on the signal. In a bearish divergent bar, we will typically see a lower low within the next 3 bars compared to the one that was printed. For example, it could take up to 3 hours on an intraday hourly chart for the signal to follow through.
Using Divergent Bars in my Trading Strategy
I have found that in Bullish Trends, Bearish divergent bars become a counter-trend signal and therefore can have a smaller probability of following through on the lower low. Whenever I see a Bearish Divergent Bar in a Bullish Trend, I typically use it as a sign to consider taking profits or to keep a close eye on a potential move back into support for me to jump back in with a bullish trade again matching with the trend.

Consolidation
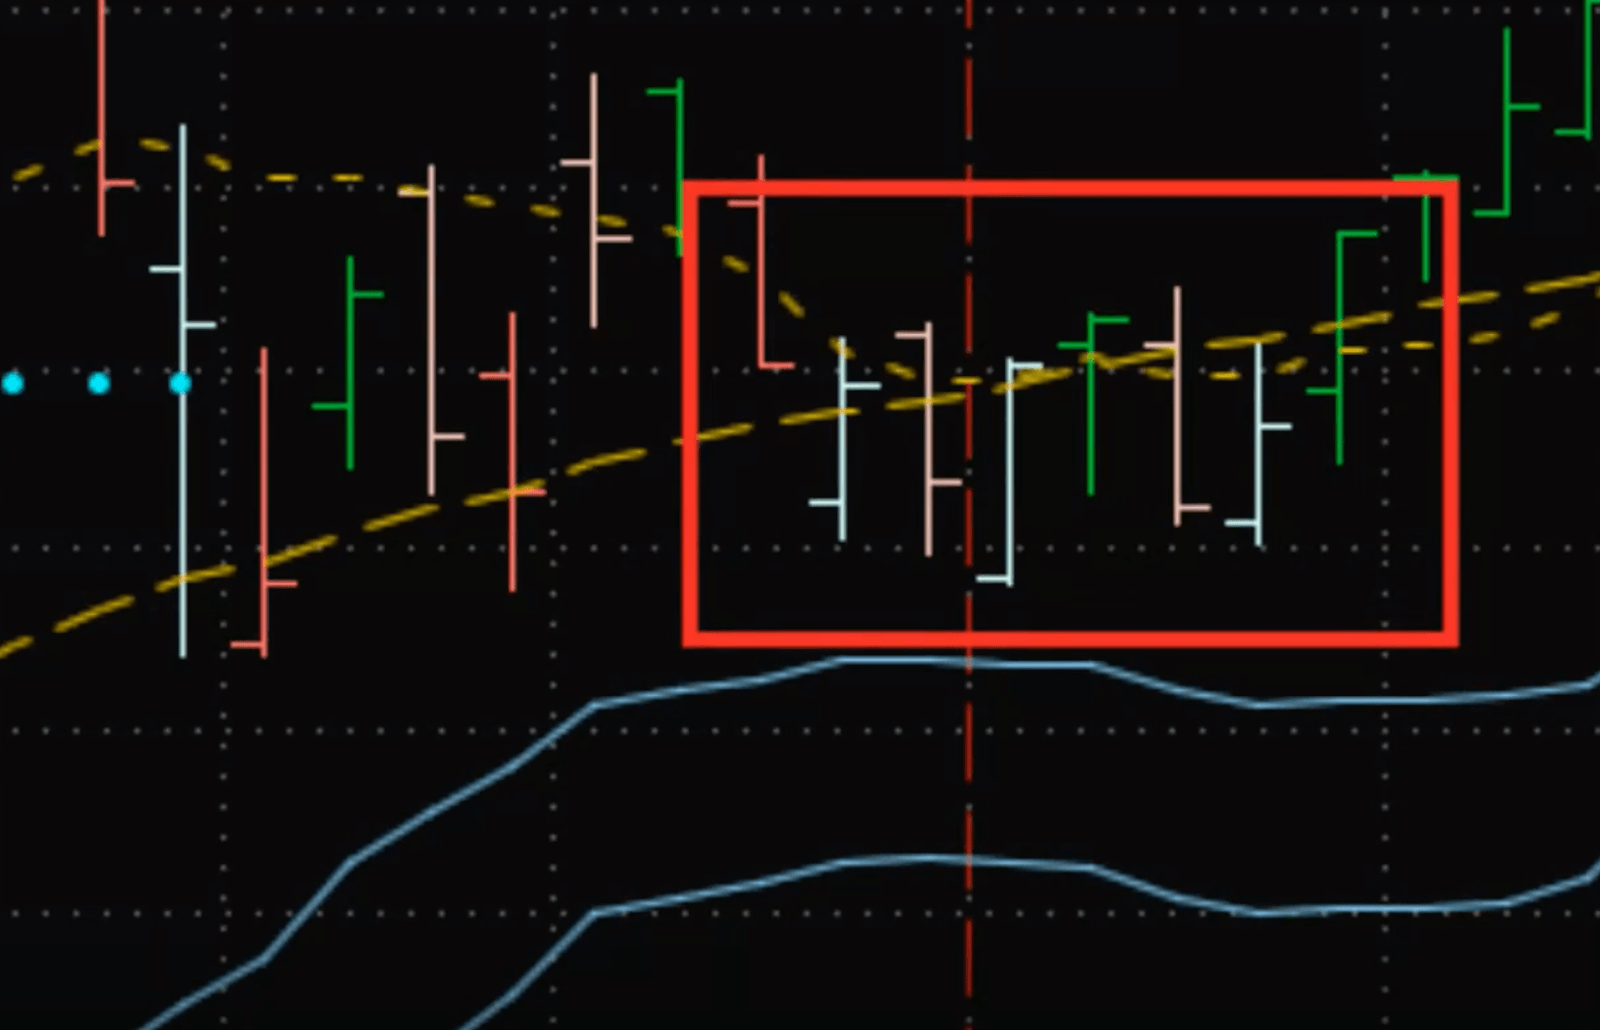
If a divergent bar prints back to back, whether it is a bearish and bullish divergent bar or two bearish and two bullish bars, this can start to be a sign of consolidation. It does not mean the signal will not follow through. But, It might not be as dramatic of a follow-through for a higher high or lower low.
In the example, you can see in the middlebox that it took 3 bars. Or 3 days, to follow through and print a lower low, showing how you have to be patient. The signals followed through but it wasn’t a very strong lower low and was a less dramatic move. However, it might not always be as dramatic. It hints at an overall sign of consolidation.
If you decide to take a trade-off of a divergent bar during consolidation, there are two things you can take into consideration.
- The first thing to consider is your Risk. You may look to hold a smaller capital risk in the trade, in case it does not follow through or is not as dramatic as a higher high or lower low.
- The other thing to consider is your Price Target. Consider taking a smaller price target with a lower good ‘till cancellation (GTC). This increases the possibility that the trade will fill and you can still take a quick profit. That’s why you’ll see in my examples, that I’m only looking at a 15 or 20-cent profit. It may not be the largest profit. But during that time on an intraday move, I’ve protected my initial capital risk completely. I have managed to lock in a small profit, and I still have a butterfly trade left. I will either cash settle into the close that day, or can close out the next day. Ideally, taking that profit on the trade itself.
- Also, consider doing strategies that benefit from the chop. For example, credit vertical spreads or unbalanced butterflies. This can be a great trade setup if the divergent bar doesn’t see a strong follow-through. As long as the short strike remains out of the money, you can typically take a profit.
How to Read a Divergent Bar
The divergent bar indicator gives a clear signal of a bullish or bearish divergent bar by a change in the bar’s color. You can customize the color for the bullish divergent bar and bearish divergent bar to whatever colors you would like. I chose light pink to represent a bearish divergent bar and cyan blue to represent a bullish divergent bar. That’s what works best for me to determine which is bullish versus the bearish divergent bar.
The divergent bar indicator can be used in any time frame. It can be used from an intraday time frame all the way to a monthly time frame. Depending on the trading strategy I’m using, I will use the bar on different time frames.
Here’s an example of SPX on an hourly intraday chart:
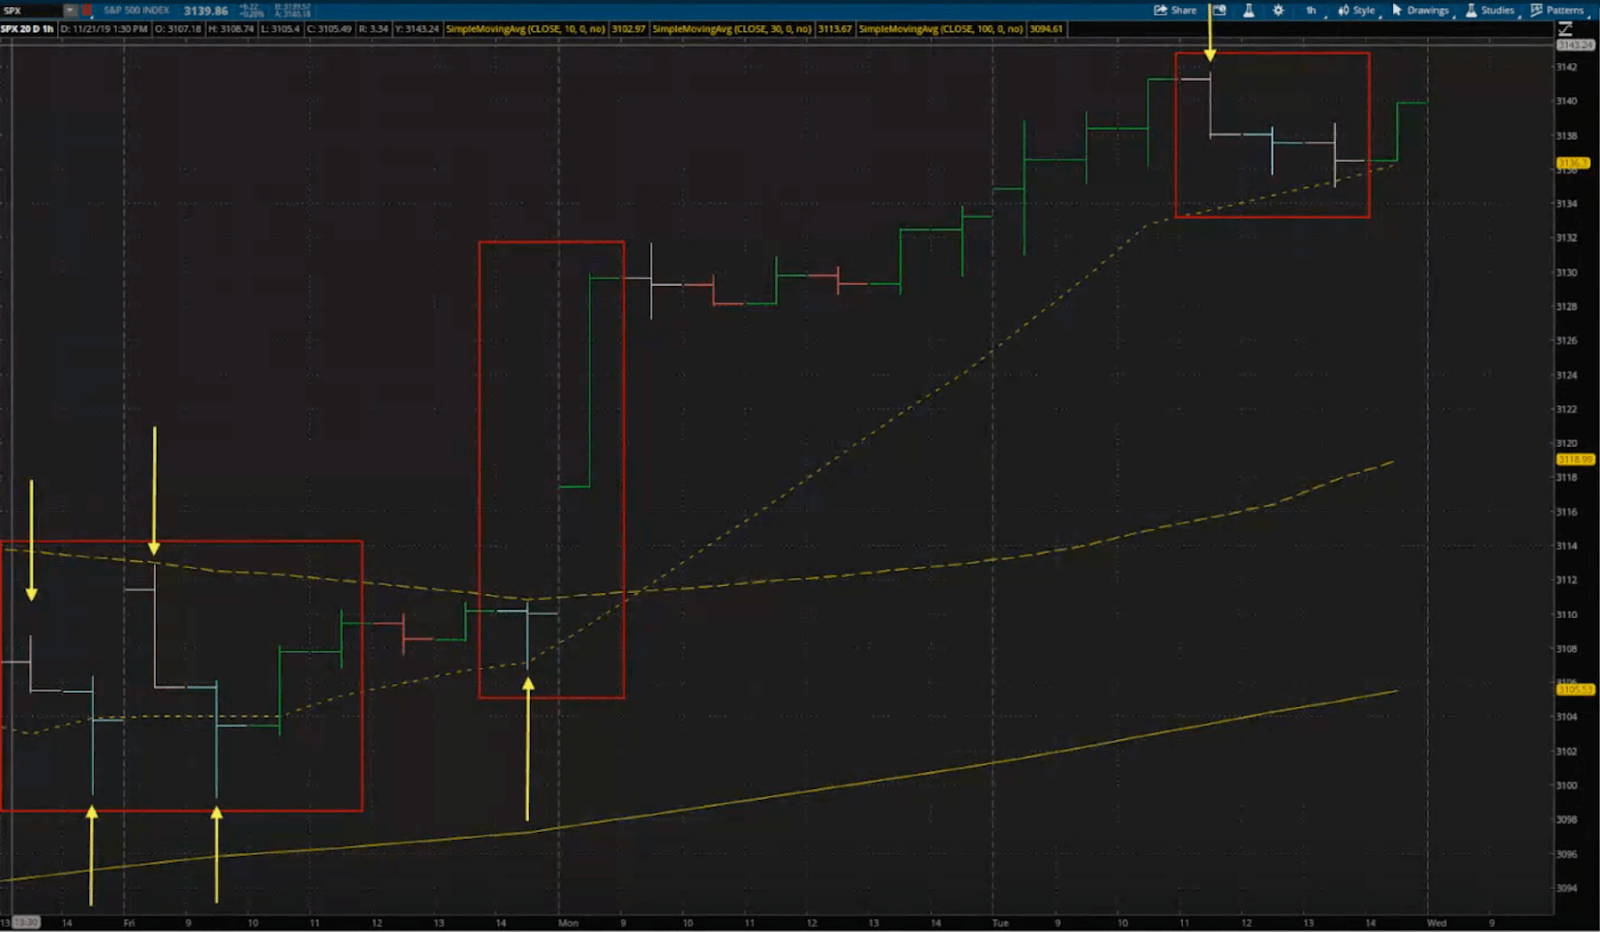
The Divergent Bar indicator only needs data from the prior bar and the current bar to form a proper signal. This is a great benefit to symbols who have had recent IPOs.
The divergent bar would be a great indicator to use because the indicator doesn’t take a lot of time or data to print a signal. Instead of waiting on more trading data to start printing valid signals on other indicators. The Divergent Bar indicator can start giving you signals the very next day. So if you are on an hourly chart, after the first hour of trading, it could potentially print signals for you.
You can use the divergent bar on any type of bar. I use the standard bar. If you prefer the candlestick bar, it can work on that as well. If you use another indicator that prints on the bar, like the GRAB Candle or the 10x bars, then the divergent bar indicator might conflict with it and not print a proper signal.
However, a great way to get around this is to create a grid chart. One chart can include the Grab Candles or 10x bars, while the other chart can hold the Divergent Bar Indicator. That way you can watch both signals, and have them both be valid and not cancel each other out.
Pro-Tip
If the divergent bar’s high (for a bullish divergent bar) and low (for a bearish divergent bar) are running right into a level of Resistance or Support. Then you’re looking for the underlying price to break that level in order for the signal to follow through. However, it might have a harder chance of doing so.
If you take the signal, keep in mind to be cautious of it. Not having a strong follow-through because the resistance (or support) might win the battle and not let the underlying price follow through all the way on the divergent bar signal. At other times, when the divergent bar matches with testing Support or Resistance, it can make for a stronger signal and potential move. That’s why I love bullish divergent bars off of support levels in bullish trends.
I like to call the Divergent Bar Batman and the Compound Breakout Tool Robin. Thanks to my trusty Divergent Bar Indicator, I’ve been able to better recognize when prices are moving up higher or down lower. You may want to consider adding it to your toolbox of strategies. And even though this indicator works great on its own, it can still help to have its sidekick to help solidify the signal and make for better entries. I highly recommend you check out the Compound Breakout Tool!
And if you’d like to see the Divergent Bar and Compound Breakout in action, join me in my Profit Recycling Mastery!

FAQs on the Divergent Bar Indicator
Q: What is a higher low in trading?
A: A Higher Low means that the stock is in an upward trend.
Q: How do you trade low lows and higher highs?
A: A higher-high simply means that the current price of the stock closed higher than the price the previous day, which signals confidence in the stock. A Lower-low means that the current price of the stock closed lower than the price before, which suggests that there is low confidence in that stock. Traders essentially use this information to seek entry and exit points within a stock.
Q: What is a lower high in trading?
A: A Lower High indicates that the market will be in a downtrend
Q: What are the recommended time frames when using the Divergent Bar indicator?
A: I would recommend using the Divergent Bars on time frames of 60 minutes or more, but with a minimum of 30 minutes.
Q: Can you customize the indicator?
A: There isn’t any type of input settings that can be changed, however, the DHscan and the DLscan do not affect the indicator, but they should not be changed regardless. But what you can customize is the color of the bars and candles as I stated in the article. It will help you better identify your setup and charts.

Originally Published: Jun 23, 2021, at 17:59