TOS – Fibonacci retracement / extension settings
Personalize a Fib drawing tool in Thinkorswim
Retracements and Extensions
Retracements
Extensions
Save a default setting
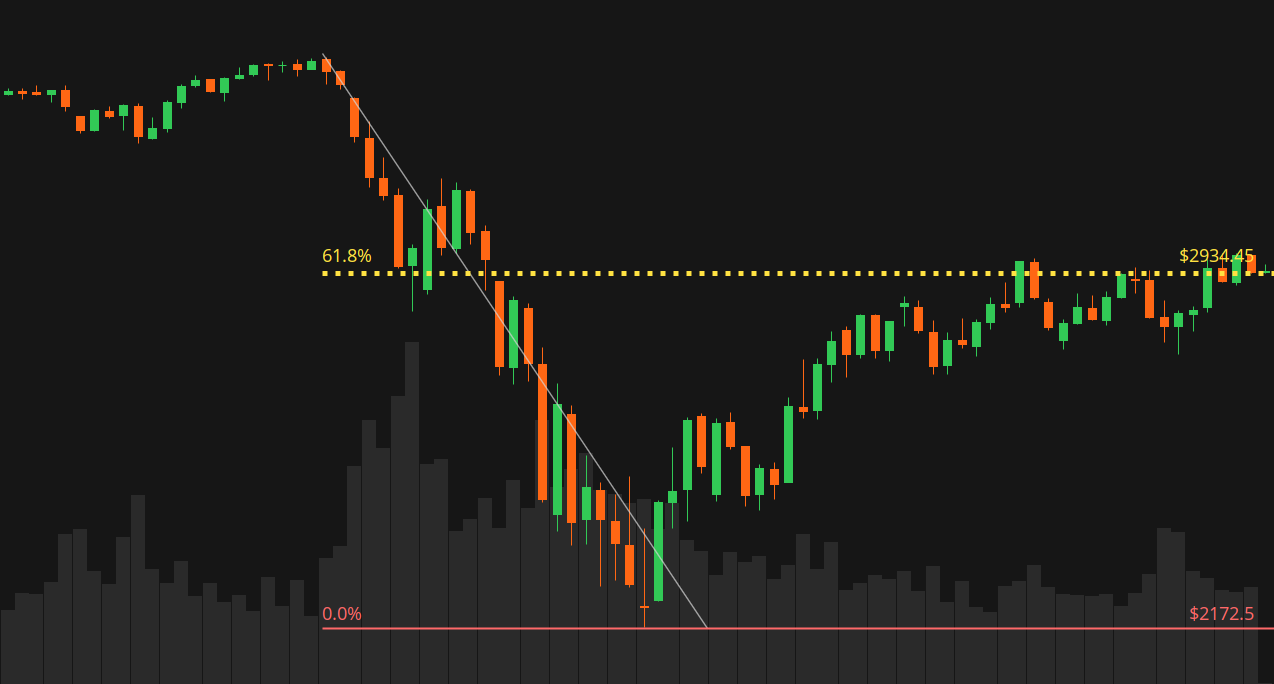
Retracements

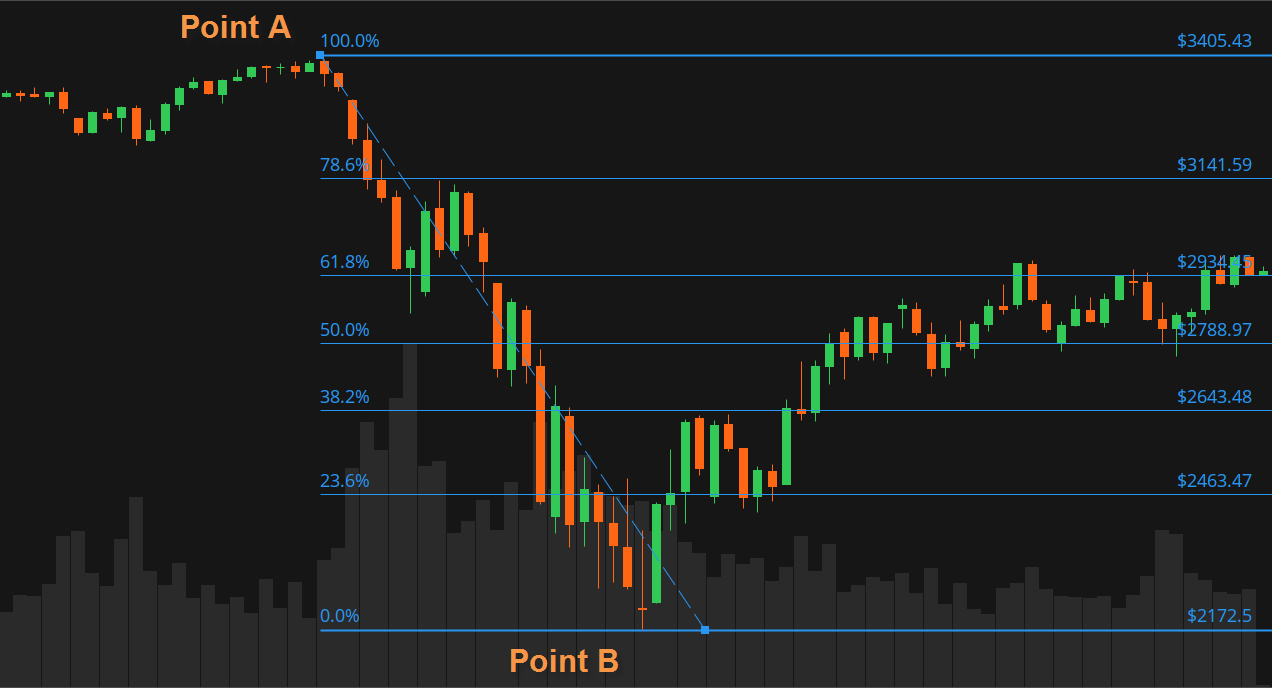
1) Place a Fibonacci retracement on the chart for possible levels of resistance or support based on a prior price move.
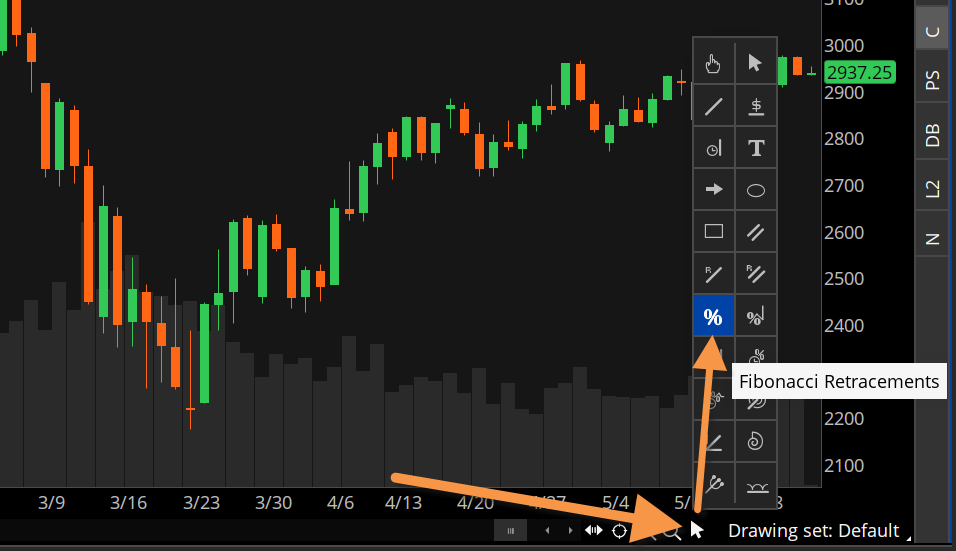
2) Click and drag between two points on the chart, typically the start (high/low) and the end (low/high) of the prior or current move.
Settings
3) Right click on any part of the Drawing to reveal a drop-down menu to Edit properties…
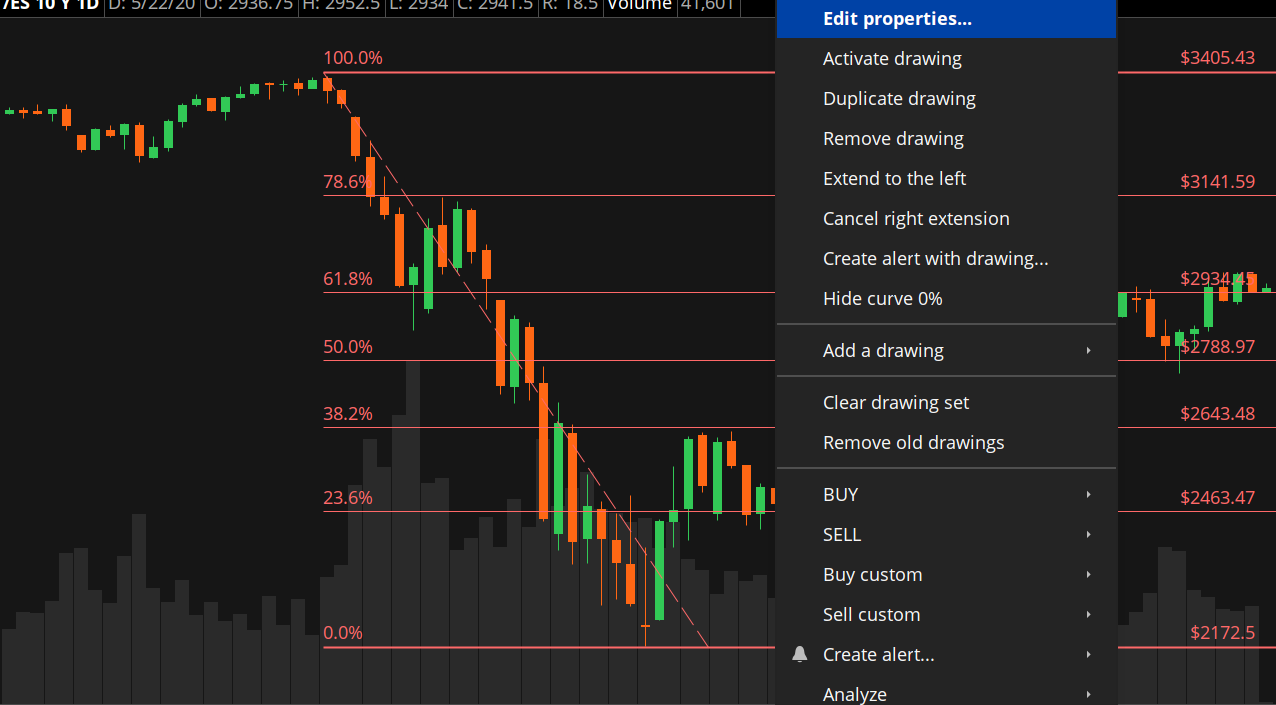
4) In the Properties window, customize the Fib drawing by:
- checking which lines you want to appear on the chart
- clicking on any number in the “coefficient” column to change the Fib levels
- change the color of the Fib level
- choose a different style of line
- increase a line’s width
- change how the lines extend on the chart and other settings
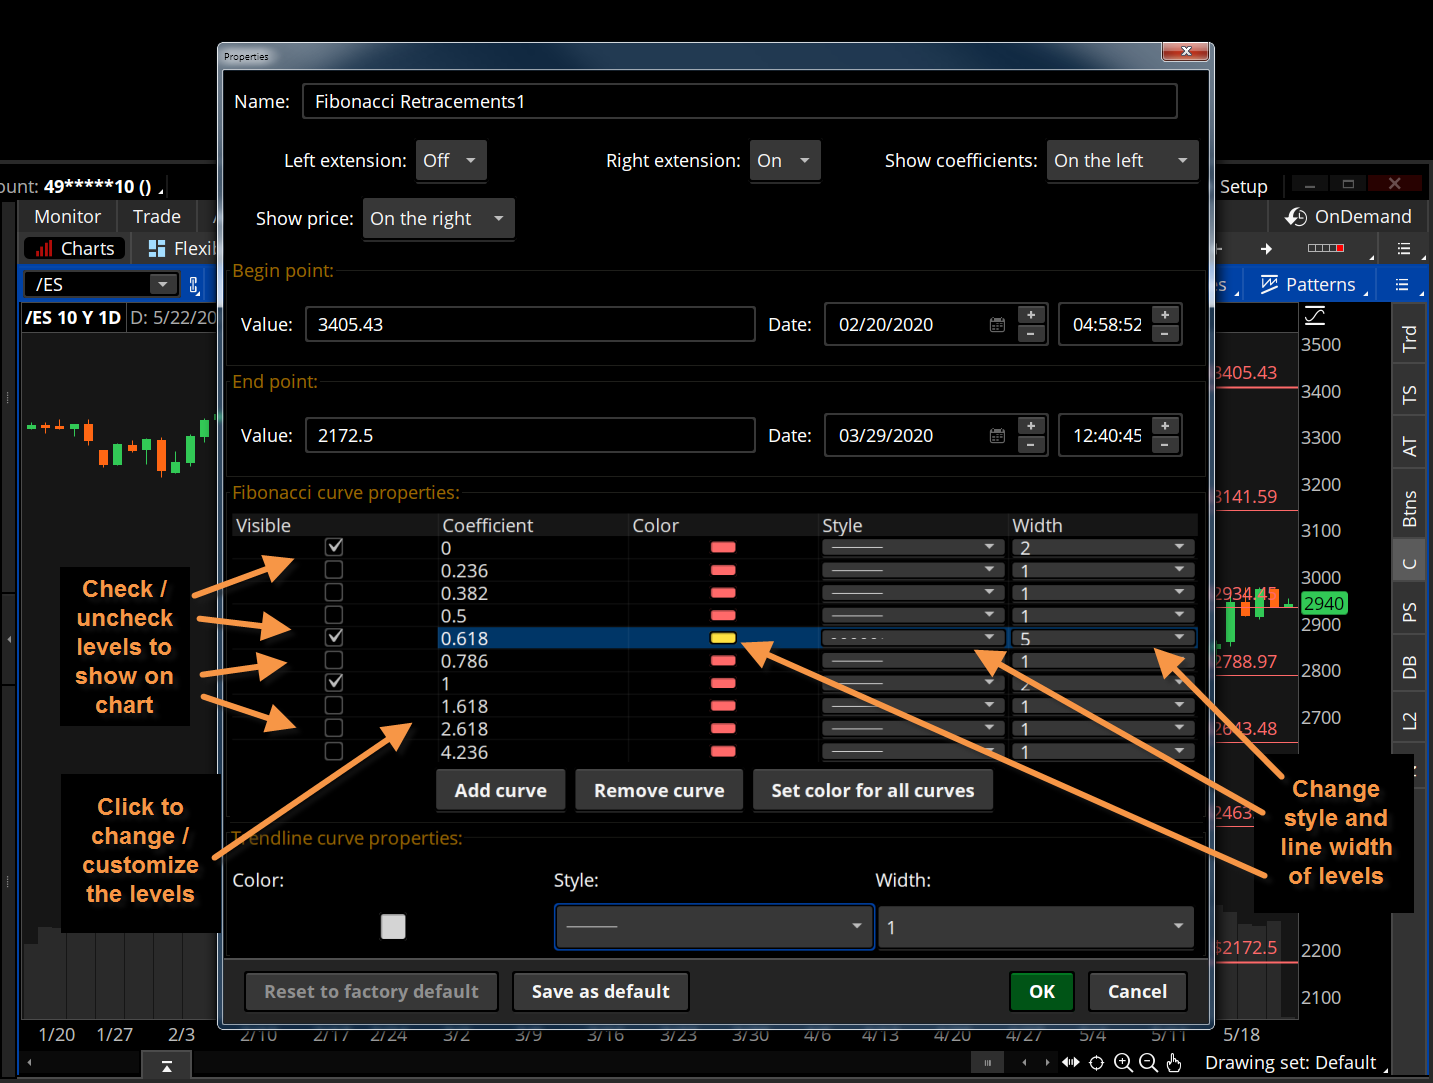
Changing settings in a Fib tool can help clean up the chart and clarify what levels are significant.
Extensions

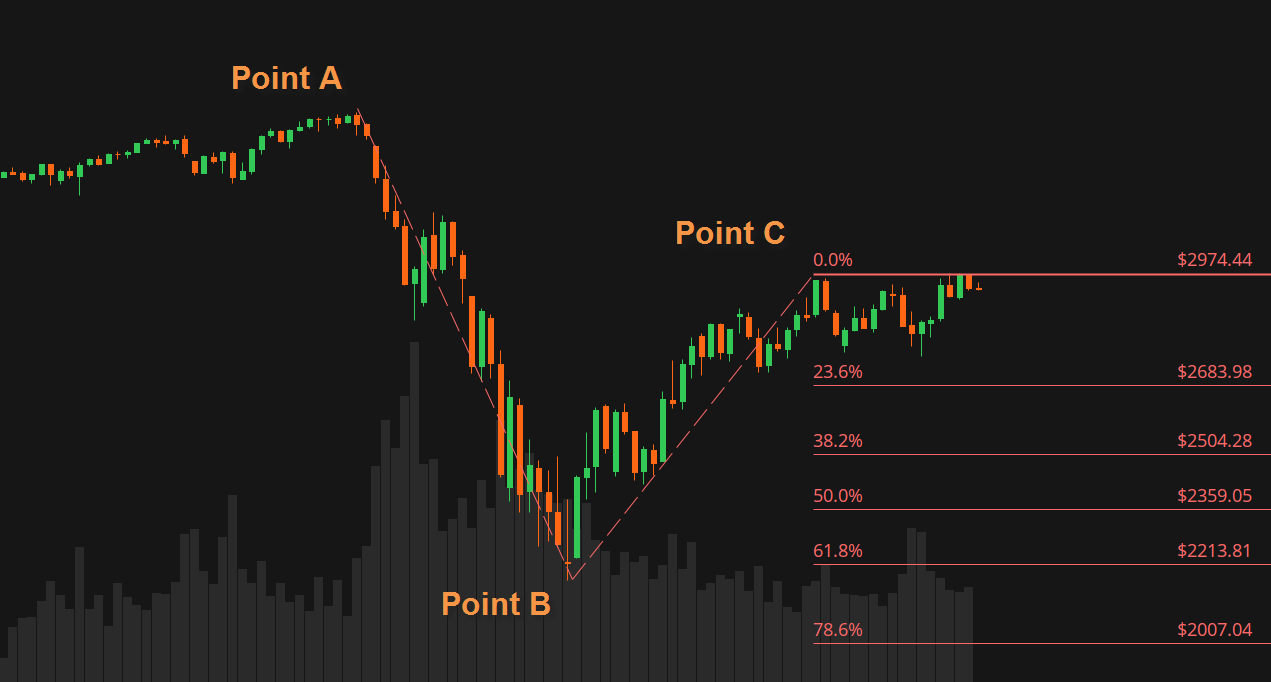
1) Place a Fibonacci extensions (aka projection) on the chart to draw a prediction of a move into the future.

2) Click and drag between two points on the chart, typically the start (high/low) and the end (low/high) of a move. Drag to a third point C. This third point is where the A-B move will be projected from.
Settings
3) Right click on any part of the Fibonacci Extension tool and change the settings (see #4 above under Retracments).