Multi Chart Layout with Indicators in TOS


TG
3 min read
Video Guide on Multi Charts and Indicators in TOS
Hello Traders! In this video, we’ll be going over creating a multi-chart layout with indicators. Thinkorswim has a lot of indicators on their platform and depending on how many you use in your trading, you might want to set up a multi chart layout to spread the indicators out.
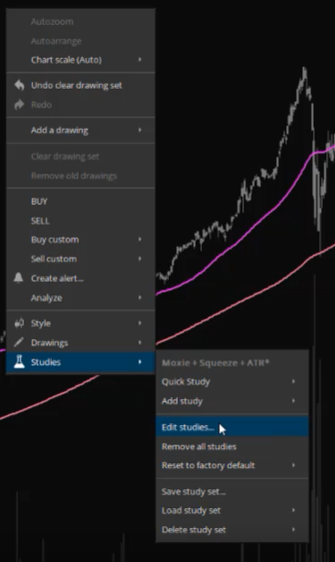
We’ll start off by right-clicking on the chart, hovering over “Studies” and then navigating to “Edit studies.”
You can also go to the top right of your screen and click on “Studies” with a beaker symbol next to it, and navigate your way to “Edit studies” as well.
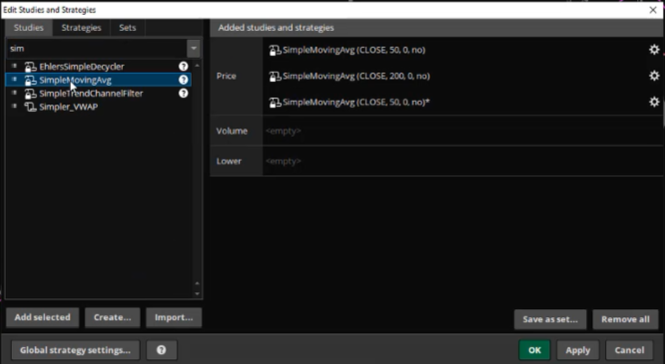
This will populate the “Edit Studies and Strategies” window on your screen.
There is an area at the top left of your screen where you are able to type the name of the study/strategy that you’re looking to upload.
Type in “sim” and you’ll see “SimpleMovingAvg” pop up in the search column, double click on it and it’ll populate to the right.
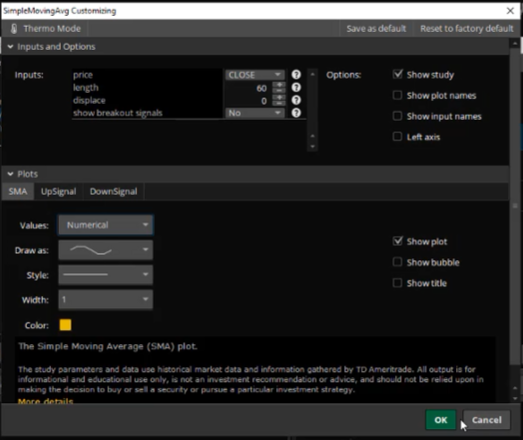
Now if you double-click on the study/strategy that you added, it will open up customizable settings.
Depending on the indicator/study, there will be different options to adjust and change, as well as many different tabs under the “Plots” section to go through and adjust.
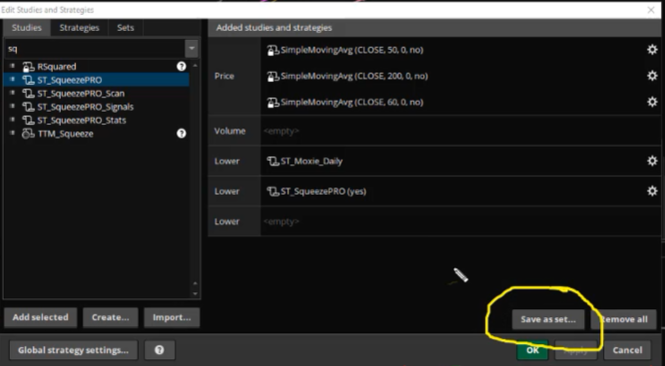
TG proceeds to add both the Squeeze Pro as well as the Daily Moxie indicator to his desired studies.
Once you have the study set you want, click “Apply” at the bottom right of the screen and it’ll populate the changes on your platform.
If you would like to save the study set you have so you can populate it on any chart you want in the future, click on “Save as set” at the bottom right of the edit window.
Make sure to give it a name that is relevant and recognizable to you.
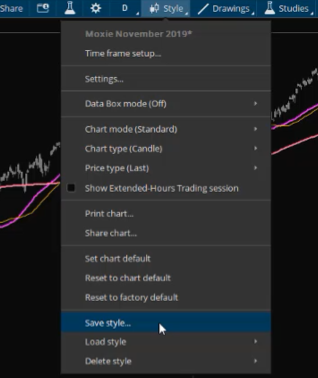
Another shortcut is to go up to the top right of your screen, hover over “Style” and navigate down until you see “Save style.”
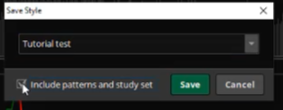
This will populate a window that allows you to save it under a specific name.
***Make sure to check the box that says “Include patterns and study set”***
If you navigate to the top right corner of your screen, there will be a box icon right next to the pin symbol in the gray, horizontal banner.
If you click on that box it’ll populate a grid setup that allows you to choose how many windows you would like to have on one of your screens.
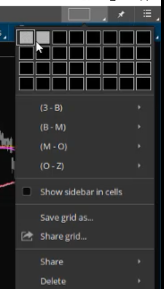
TG chooses to do two chart windows, side by side.
Notice that the second chart window does not populate with the same settings that our original one has.
TG also connects the two charts by clicking on the link icon next to the ticker symbol window and making sure they are both populated with a red #1.
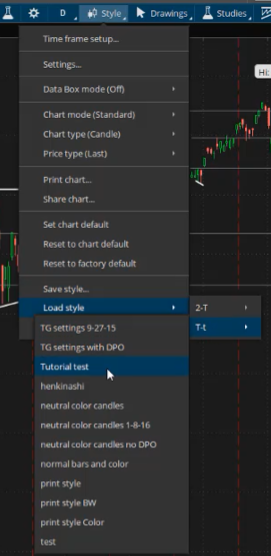
To load the settings we just saved, navigate up to “Style,” scroll down to “Load style,” and choose the style setting of your choice!
That concludes our breakdown of setting up a multi-chart setup with indicators!