About – Ready Aim Fire (RAF)
What is the RAF study and how do I use it?
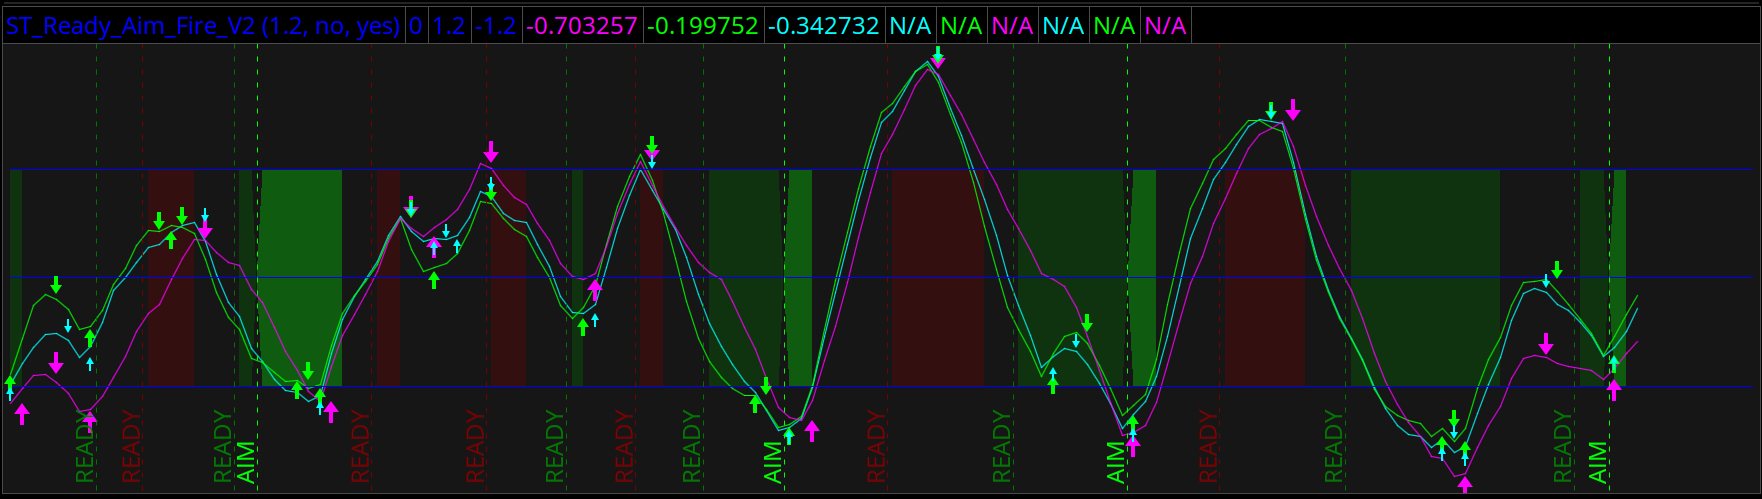
What is the Ready Aim Fire Indicator?
RAF was designed as a trigger indicator to help identify reversals as points of interest.
The Ready Aim Fire Indicator or RAF for short, is a key identifier of buy and sell signals based on historical strength and resistance. It is designed to spot short-term trading opportunities as markets begin to turn. Markets tend to ebb, and flow and the best strategies take advantage of this.
These opportunities typically arise where prices have either contracted and coiled the market strength or areas where moves have been made recently and there is a tenancy for exhaustion to play out where prices dips back down in a “reversion to the mean” pattern.
The clusters of arrows and oscillators are designed with Voodoo Lines support and resistance in scope to best derive a decision of whether or not one can expect price to reverse, hold or move higher.
Ready, Aim, Fire was developed by Simpler’s own David Starr with one goal in mind… to understand when a price level is likely to break or hold by showing overbought and oversold conditions.
Ready, Aim, Fire is a price oscillator that dynamically shows if a stock is overbought or oversold on short, intermediate and long-term time frames. The underlying calculation of RAF gives a smoothing effect to the indicator to minimize false signals and provides additional validity to signals generated.
Major buy or sell signals on Ready. Aim. Fire! can turn into powerful moves as the market pendulum swings to the other direction.
At the most basic level, it can give very specific buy and sell signals. However, like many technical indicators, there is also tremendous power to the subtle signals it generates.
The more time one spends watching the market in conjunction with the indicator, the more one sees how variations in the patterns convey important information about the attractiveness of a trade.
How do we use it?
We use Ready. Aim. Fire! to quickly gauge whether a stock is overbought or oversold, that provides additional information as to what action we should take at major levels on the chart.
RAF works best when paired with a support or resistance level, whether that level is Darvas 2.0, a Voodoo Line, or Fibonacci extension. Because RAF shows overbought and oversold as well as generating buy and sell signals, we can use this information to understand whether a level is likely to hold or break.
The ideal condition for a major buy signal would be a stock dips in to a known support level and the RAF turns and registers a major buy. That tells us that the stock is at support and the downward momentum has turned. We want to be buying these situations.
An ideal major sell would be price moves up in to a known resistance level and registers a major RAF sell signal at the same time. This tells us that the stock has a ceiling overhead and not enough momentum to break through it at the moment. We want to be selling these situations.
RAF works on all timeframes and all markets from stocks & options to futures or forex.