New Micro Voodoo Line Strategy Basic Bundle
How to Automatically Predict Tradeable Levels in a Violently Choppy Market


“Start each day with an open mind. The market is much more powerful than we are and cares very little about what we want from our trades. With the right frameworks, we can learn to listen to what the market wants and trade accordingly.”
David is Simpler Trading’s “Mad Scientist”. He is the creator of the popular Voodoo Lines(r) and Ready, AIm, Fire! indicators. A trained theoretical mathematician who later took his MBA first in his class, he now trades full time in addition to helping Simpler Trading clients achieve their own success. Many might consider David’s academic achievements and his experience as a strategic management consultant, building companies, and taking them public, to be some of the most respected as ideal preparation for success in financial markets. However, he is passionate in stressing that the key to trading success is understanding and managing one’s own emotions. David’s consulting clients prize his ability to provide customized insights into unique business situations. In the same way, traders who have taken David’s classes or listen to him daily in the Simpler Voodoo Mastery room use his insights to take their trading to the next level. David understands that the same trading style which might allow one trader to approach markets in a calm, collected manner is ideal for reaping profits. Be that as it may, this might provoke the emotional demons that incite account-destroying behavior in another.
Generally, more experienced traders are able to quickly assimilate the trading lessons. David shares his trading lessons and his talent for solving problems in new and refreshing ways. Yet, traders of all experience levels make use of his technical indicators and the out-of-the-box thinking which lead to their development. Even if you don’t yet use one of these tools, you might be surprised to learn that you already make use of his technology on a regular basis as his patented innovations in wireless technology are inside virtually every smartphone on the planet.
For his own trading, David relies heavily on Elliott Wave analysis, sharing his insights into market trends nightly in his Elliott Wave dispatch and interacting daily with the traders in the Simpler Voodoo Mastery room. Viewed by many as too complex, arcane, or unreliable to use regularly, again our Mad Scientist has his own out-of-the-box approach. David regularly hears from clients that his “language of the market” analogy, which describes how Elliott Wave is a language markets use to communicate with us, finally made this style of analysis easily understandable and that his Elliott Wave analysis of markets provides them actionable trade ideas.
Even with a more accessible approach, not every trader wants to learn about Elliott Waves. So, David went into his lab and found a way to turn Elliott Wave analysis on its head and make all of its weaknesses into strengths. Too many people abandon the style of analysis viewing it as too subjective or only accurate in hindsight. If everyone agrees it’s accurate in hindsight, David thought, “let me create a tool which projects current prices from waves which occurred long enough in the past that there’s no argument about the pattern.” Voodoo Lines was the result and not only do traders love how magically it tends to find support and resistance, they also appreciate that all they have to do is look at lines on a chart without any complex wave knowledge required.

Learn to avoid the biggest obstacle to consistent profits with a “market map” designed to nail entries and exits with astonishing precision. This Bundle contains the Voodoo Lines® indicator, a monthly subscription for the stock updates, the accompanying strategy class, a membership to Henry and David’s Voodoo Mastery, and more.
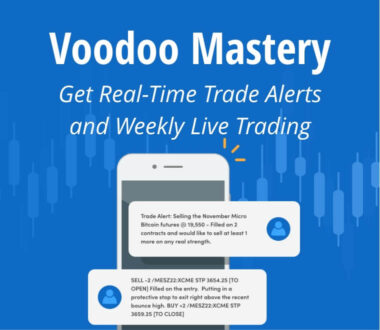
Follow along in real-time as Henry Gambell and David Starr identify profitable options trades with their precise Voodoo Mastery program. Fact is, Identifying the correct time and price can make or break traders. Let the masters “map out the market” for you with monthly interactive live trading, real-time trade alerts, and interactive Q&A sessions.
 How to Scan for stocks
Research and information are one of the most critical aspects to finding the best stocks in the market. But, it’s impossible to... Read More
 Hindenburg Omen – Signals of a Possible Market Crash
In this post: What is a rare market signal that tells traders to prepare for a possible significant decline? In what year... Read More
 Voodoo Lines Firelines Explained
In this post: What do the Voodoo Lines show? What is the most important support and resistance levels offered by the Voodoo... Read More

A Trader’s Phrase Book
Enter your name and email below and David will send you his guide to download for FREE!
Markets fascinate me. I am intrigued by business and commerce, modeling complex systems, and developing new things. So, understanding the complex ways that prices move in financial markets, and discovering ways to profit from that movement, has always held my interest. Put simply, trading allows me to go to work each day looking forward to what I will see, learn, and do; all while getting paid for doing it.
Trend Trading Broad Markets:
I use technical analysis to implement a trend trading approach by identifying trends and then joining those trends on counter-trend retracements. Elliott Wave analysis will be used to identify the trend, counter-trend retracements, and trade entry signals. I will use technical tools including Ready. Aim. Fire!® Pro, DynaRange®, Spark Shooter, trend lines, market profile, Fibonacci analysis, and more as supplemental trade entry signals once both a trend and counter-trend retracement have been identified.
I use this approach on broad markets including equity indices, currencies, and commodities.
Short-Term Trading Broad Markets:
When Elliott Wave analysis suggests a market is in the strongest section of a trend, I will take intraday and other short-term trade setups. At other times, I will not trade intraday. Furthermore, this approach will be limited to only the most liquid and actively traded markets like the S&P 500 futures, Euro Currency futures, and Crude Oil futures.
Swing Trading Equity Options:
I use Elliott Wave analysis to form an opinion on the direction of U.S. equity markets more broadly. Then I will trade options on individual stocks in the direction of the broad trend using Voodoo Lines®, Ready.Aim.Fire!®, exponential moving averages, and The Squeeze to identify trades. I look for bullish opportunities with the Daily Bullish Continuation scan and 195m Bullish Continuation scans in the Simpler Trading Scanner as well as stocks on the IBD Growth 250 list. I look for bearish opportunities with the Daily Bearish Continuation scan and 195m Bearish Continuation scan.
Yearly:
My goals are matched to my approach. Larger trends cannot be manufactured by a trader. I have found that it is practical to find 2-3 tradeable, larger trends per year. My trading goals, therefore, are to catch 2 large trends each year in the futures markets. If I do this, profits will take care of themselves. I cannot, and will not, limit myself to only trading twice each year for several reasons:
Yearly:
My objectives are constantly changing to direct my focus on a limited number of items which will further my ability to meet my goals. They are typically either known blind spots or activities which have been key to my success of which I need to be reminded. These are my current objectives.
Futures, futures options, equity index options, stocks, and stock options
Depends on size of the move. Can adjust the timeframe of the chart so that the number of bars required to move from one line to the other is as close to 50 bars as possible.
Joining a trend in a broad market:
My objectives are constantly changing to direct my focus on a limited number of items which will further my ability to meet my goals. They are typically either known blind spots or activities which have been key to my success of which I need to be reminded. These are my current objectives.
Fading for a reversal in a broad market:
Fading a major top or bottom is the trading version of a buzzer-beating three point shot from half-court. It is exhilarating, dramatic, and involves both skill and luck. While it can be rewarding, the opportunity for it does not come along every day. If I do not have a good all-around game, then I will not be on the court (let alone on the team) when chance presents itself. The ingredients for this trade are:
Bullish equity option trade:
This is a trade to execute when the U.S. equity market is in an uptrend evidenced by an incomplete upward-moving Elliott Wave pattern observed in the S&P 500. When there is also a downward correction which appears plausibly complete, I will look to enter bullish options trades on U.S. equity names which are holding key moving averages selected from:
Bearish equity options trade:
This is a trade to execute when the U.S. equity market is in a downtrend evidenced by an incomplete downward-moving Elliott Wave pattern observed in the S&P 500. When there is also an upward correction which appears plausibly complete, I will look to enter bearish options trades on U.S. equity names which are holding below key moving averages selected Bearish Continuation scans from the Simpler Trading Scanner.
Intraday / Short-Term trades:
In most market conditions, Short-Term trading is only for trying to enter larger moves with short-term trades to minimize risk. However, when a market appears to be in the middle of a larger-degree third wave, I will take a variety of Intraday setups only in the direction of the third wave move.
Enter a trade once all the elements of a setup have been observed.
Initial stops will be placed just beyond where the pattern leading to the setup becomes invalid. If the trade continues in the anticipated direction, and a spot closer to current prices would invalidate the expected pattern, then it can be used to move stops closer to current prices.
I will manage positions in multiple units so that if a trade goes my way I can take profit at different points.
Early Units:
Since many of my setups involve using short-term signals to enter a trade with the potential for a longer-term move, there is always the potential that markets move in the anticipated direction in reaction to the short-term signal, but don’t continue. I will take partial profits on early units at the objective(s) for the specific short-term signal. It is possible to trail a stop closely behind price once short-term objectives are met in order to exit, the purpose of early units is to reduce risk on positions and lock in profits, therefore, lean toward simply exiting at objectives. If objectives are nearby near the end of the day, especially if it is Friday, be more aggressive about exiting early units by either scaling out slightly shy of objectives, increasing the number of units exited, or both.
Late Units:
The purpose of late units is to stay with a move until it either: 1) reaches reasonable objectives for the setup; or 2) invalidates the setup. Therefore, the management is to wait until minimum objectives are met so long as stops at validity are not taken out. Once objectives are met, trail stops behind a fourth wave to allow the move to try and continue. In circumstances where there is a boundary that price is not expected to cross, and the reduction in unrealized profits between current prices and the stop exceeds reasonable profits achieved by staying in, I will consider exiting on a limit without waiting for a stop to get taken.
Scan overnight news:
Update Elliott Wave charts:
Update ES Market Profile:
Review open positions:
Is the management plan for any open positions affected by the implied open?
Prepare plan for the day:
Update trade documentation:
Update Elliott Wave analysis for active markets:
For each market which I am actively following using wave analysis, review the charts:
Update Market Profile Chart:
Review stocks with open positions:
Review stocks on watch lists:
Review Scans:
Overall Market Review:
Ponder market scenarios:
What Tools will I use for my trading business?
Voodoo Lines®, Ready.Aim.Fire!® Pro (Classic Ready.Aim.Fire!® can also be used).
Contemporaneous trade documentation:
Capture a chart at each entry, exit, and adjustment. Note the logic behind the action if not obvious. For options trades, capture the options chain and, if appropriate, capture TOS analysis tab. Capture information for any trades not taken at the end of the day. Decisions not to trade need to be reviewed alongside trades taken.
End-of-day review:
At the end of each trading day, I have two tasks to accomplish. The first is to ensure that trade documentation is complete. Sometimes events during the trading day preclude complete documentation and, in those cases I want to fill in the details while things are still relatively fresh. The second activity is to ensure that I am not trading in a self-destructive manner. Daily course correction is usually too frequent; one more day of trade results will generally not alter a statistical analysis of trading results. However, when reviewing the day’s trades, also note if rules are being broken. If so, corrective action must be taken immediately and not delayed. This is the only review I will do more frequently than once per month.
Monthly review:
Approximately once a month, usually on the first weekend after the end of the month, I will conduct a more comprehensive review of results. This review starts with organizing and tabulating the results. Among the things which are recorded for each trade are:
There is no set process to analyzing the results once tabulated. I do glance at summary metrics like year-to-date P/L, win %, and what types of trades are current focus. These provide context and beyond that I just roll around in the data guided by a number of prompts such as:
Semi-Annual review:
On a less frequent basis I will step back and ponder some bigger questions. This is less about reviewing data and more about reviewing both goals and process. I conduct this broader review twice each year at the beginning of February and the beginning of August. Prompts I consider are:
Evolution, inspiration, and innovation are key to my trading. I cannot know where ideas might come from, therefore I will seek to learn what I can about a wide variety of topics even those which do not immediately have any obvious connection to trading.
Market intuition is a thing. It is a codeword for the ability to process more inputs of information generated by the market than can be factored into the rules of a single setup. I will work to continue developing my trading intuition. At the same time, I recognize that if taken to the extreme this could be a free pass to ignore rules completely. It is much easier to monitor discipline when there are hard and fast rules to be followed. In this context, however, discipline is determined by how strictly I adhere to my review process and how honest I am with myself in that process.
There is nothing more golden than the plan. The plan is the rule and the rule is the plan. There is plenty of trading wisdom out there and plenty of witty aphorisms out there and many of them resonate with me. If they are important and they will affect my trading, they belong in the plan.


Uses and Abuses of Financial Derivatives, Third Edition, by John E. Marthinsen, goes to the heart of the arcane and largely misunderstood world of derivative finance and makes it accessible to everyone—even novice readers.
Learn More
Master technical analysis, step-by-step! Already the field’s most comprehensive, reliable, and objective introduction, this guidebook has been thoroughly updated to reflect the field’s latest advances.
Learn More
Professional and individual traders haverelied on Trading Systems and Methods for over three decades. Acclaimed trading systems expert Perry Kaufman.
Learn More
One of today’s most successful traders, John F. Carter has made his popular guide more relevant and effective than ever.
Learn More
Douglas uncovers the underlying reasons for lack of consistency and helps traders overcome the ingrained mental habits that cost them money.
Learn MoreLifeSpan Fitness TR5000-DT3 Under Desk Treadmill
The tr5000-dt3 flat motorized treadmill base is intended to fit under your standing desk workstation to provide an exercise and ergonomic boost to computer and laptop work.…
Buy Now
Crescendo Headphone Holder Under Desk
The Crescendo CR40 Headphone Hanger is an under desk mount for discreet convenient storage.…
Buy Now
Elgato Stream Deck XL
Boasting 32 customizable LCD keys poised to launch unlimited actions with a tap, Stream Deck XL takes live production control to a whole new level….
Buy Now
Wschic Feng Shui Money Frog
Money frogs represent the feng shui trinkets of prosperity. It is said that this fabulous creature appears in the full moon, near the house or business that is about to receive good news…
Buy Now
SENNHEISER HD 559 Open Back Headphone - Black
Powered by Sennheiser’s proprietary transducer technology for truly excellent sound performance, the open back HD 559 is the ideal choice for listeners… Buy Now
Buy Now
Shure SM7B Cardioid Dynamic Microphone
The SM7B dynamic microphone has a smooth, flat, wide-range frequency response appropriate for music and speech in all professional audio applications.…
Buy Now
Steinberg UR22C 2IN/2OUT USB3.0 Type C Audio Interface with Kellopy Pop Filter & XLR Cable Bundle
This is the perfect audio partner for composing and producing songs anywhere.…
Buy Now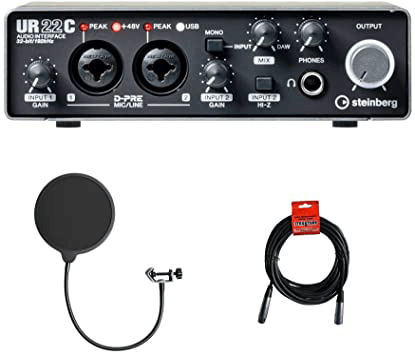
Dell U2717D IPS 27” UltraSharp InfinityEdge Slim Widescreen LED LCD Monitor VESA
Seamless and precise: the world’s first InfinityEdge Monitor has the world’s thinnest borders on all sides of the screen, creating an almost seamless multi-monitor view.…
Buy Now How to Scan for stocks
Research and information are one of the most critical aspects to finding the best stocks in the market. But, it’s impossible to... Read More
Hindenburg Omen – Signals of a Possible Market Crash
In this post: What is a rare market signal that tells traders to prepare for a possible significant decline? In what year... Read More
Voodoo Lines Firelines Explained
In this post: What do the Voodoo Lines show? What is the most important support and resistance levels offered by the Voodoo... Read More
A Trader’s Phrase Book
Enter your name and email below and David will send you his guide to download for FREE!
November 4, 2020
The video is about the importance of market trend in trading information but also try to cover the following subject:
How to Scan for stocks
Research and information are one of the most critical aspects to finding the best stocks in the market. But, it’s impossible to... Read More
Hindenburg Omen – Signals of a Possible Market Crash
In this post: What is a rare market signal that tells traders to prepare for a possible significant decline? In what year... Read More
Voodoo Lines Firelines Explained
In this post: What do the Voodoo Lines show? What is the most important support and resistance levels offered by the Voodoo... Read More
A Trader’s Phrase Book
Enter your name and email below and David will send you his guide to download for FREE!
How to Automatically Predict Tradeable Levels in a Violently Choppy Market
Want a proven "magic market map"? Predicting the highest probability options trades
Designed to expose dynamic support and resistance levels in the most actively traded stock indexes
We like the Trend Spark to enter short-term intraday trades, especially in futures.
3-Step System John Carter Used to “Shatter the 8-Figure Barrier” and Make $16.8 Million in a Pandemic Market
DynaRange shows projected swing targets based on price momentum before it becomes obvious to the market.